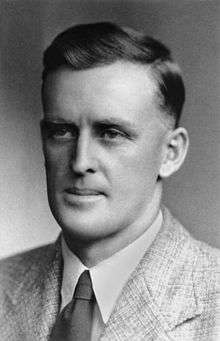
Queensland state election, 1969

Queensland state election, 1969
Queensland
17 May 1969 (1969-05-17)

All 78 seats in the Legislative Assembly of Queensland
  First party Second party
 
Leader Joh Bjelke-Petersen Jack Houston
Party Country/Liberal coalition Labor
Leader since 8 August 1968 12 October 1966 (1966-10-12)
Leader's seat Barambah Bulimba
Last election 47 seats 26 seats
Seats won 45 seats 31 seats
Seat change Decrease2 Increase5
Percentage 44.70% 44.99%
Swing Decrease0.08 Increase1.15

Premier before election

Joh Bjelke-Petersen
Country/Liberal coalition

Elected Premier

Joh Bjelke-Petersen
Country/Liberal coalition

Elections were held in the Australian state of Queensland on 17 May 1969[1] to elect the 78 members of the Legislative Assembly of Queensland.

The Country-Liberal Coalition won its fifth consecutive victory since it won government in 1957. It was also the Coalition's first victory under new leader Joh Bjelke-Petersen after the brief premierships of Gordon Chalk and Jack Pizzey, who in turn had succeeded Frank Nicklin when he had retired the previous year.

The election campaign was characterised by tension between the governing coalition partners.

Results

The election resulted in another win for the Coalition, but a strengthening of the Country Party's position vis-a-vis the Liberal Party. Labor gained back two seats held by ex-Labor ministers who had defected in the 1957 split when both retired, and gained one seat off each of the coalition partners; however, the Country party gained the seat of Burdekin following the conservative independent incumbent's retirement. Labor retained Isis, which it had gained unexpectedly at a November 1968 by-election from the Country Party following Premier Jack Pizzey's death.

Queensland state election, 17 May 1969
Legislative Assembly
<< 1966 1972 >>

Enrolled voters 945,583
Votes cast 867,743 Turnout 91.77% -1.50%
Informal votes 15,566 Informal 1.79% +0.16%
Summary of votes by party
Party Primary votes % Swing Seats Change
  Labor 383,388 44.99% +1.15% 31 + 4
  Liberal 201,765 23.68% -1.81% 19 – 1
  Country 179,125 21.02% +1.73% 26 ± 0
  Democratic Labor 61,661 7.24% +0.99% 1 ± 0
  Independent 24,268 2.85% -1.91% 1 – 3
Total 852,177     78  

Post-election pendulum

COUNTRY/LIBERAL SEATS (45)
Marginal
Hawthorne Bill Kaus LIB 0.02%
Bowen Peter Delamothe LIB 1.4%
Windsor Bob Moore LIB 1.5%
Ashgrove Douglas Tooth LIB 2.8%
Burdekin Val Bird CP 4.2%
Murrumba David Nicholson CP 4.2%
Mirani Tom Newbery CP 4.5%
Wavell Arthur Crawford LIB 4.8%
Kurilpa Clive Hughes LIB 4.9%
Flinders Bill Lonergan CP 5.1%
Aspley Fred Campbell LIB 5.5%
Fairly Safe
Callide Vincent Jones CP 6.8%
Ithaca Col Miller LIB 6.8%
Nundah William Knox LIB 6.8%
Merthyr Ray Ramsden LIB 7.3%
Mount Gravatt Geoff Chinchen LIB 7.8%
Yeronga Norm Lee LIB 8.6%
Chatsworth Bill Hewitt LIB 8.7%
Whitsunday Ron Camm CP 8.7%
Balonne Harold Hungerford CP 8.9%
Redcliffe Jim Houghton CP 9.3%
Mulgrave Roy Armstrong CP 9.8%
Somerset Harold Richter CP 9.9%
Safe
Clayfield John Murray LIB 10.3%
Warwick David Cory CP 10.5%
Mackenzie Neville Hewitt CP 11.3%
South Coast Russ Hinze CP 12.4% v LIB
Greenslopes Keith Hooper LIB 12.6%
Gregory Wally Rae CP 12.7%
Fassifern Selwyn Muller CP 13.4%
Sherwood John Herbert CP 13.6%
Roma Ken Tomkins CP 14.1%
Carnarvon Henry McKechnie CP 14.4%
Hinchinbrook John Row CP 14.9%
Gympie Max Hodges CP 15.3%
Burnett Claude Wharton CP 15.9%
Toowong Charles Porter LIB 17.3%
Cooroora David Low CP 17.6%
Mount Coot-tha Bill Lickiss LIB 18.5%
Landsborough Mike Ahern CP 18.7%
Cunningham Alan Fletcher CP 19.2%
Lockyer Gordon Chalk LIB 20.7% v IND
Albert Cec Carey CP 25.2%
Condamine Vic Sullivan CP 25.2%
Barambah Joh Bjelke-Petersen CP 28.2%
LABOR SEATS (31)
Marginal
Toowoomba West Ray Bousen ALP 0.6%
Townsville North Perc Tucker ALP 0.7%
Logan Edgar Baldwin ALP 1.6%
Rockhampton South Keith Wright ALP 2.2%
Tablelands Edwin Wallis-Smith ALP 2.4%
Isis Jim Blake ALP 4.4%
Warrego Jack Aiken ALP 4.5%
Norman Fred Bromley ALP 4.6%
Toowoomba East Peter Wood ALP 4.6%
Fairly safe
Cook Bill Wood ALP 6.1%
Ipswich West Vi Jordan ALP 6.3%
Mourilyan Peter Moore ALP 6.9%
Maryborough Horace Davies ALP 7.5%
Bundaberg Lou Jensen ALP 8.1%
Barcoo Eugene O'Donnell ALP 8.4%
Belmont Fred Newton ALP 8.8%
Brisbane Brian Davis ALP 8.8%
Ipswich East Evan Marginson ALP 9.5%
Safe
Mackay Ed Casey ALP 10.5%
Kedron Eric Lloyd ALP 11.6%
South Brisbane Col Bennett ALP 12.3%
Burke Alex Inch ALP 13.0%
Wynnum Edward Harris ALP 13.2%
Nudgee Jack Melloy ALP 13.9%
Sandgate Harold Dean ALP 14.7%
Cairns Ray Jones ALP 15.5%
Baroona Pat Hanlon ALP 15.7%
Rockhampton North Merv Thackeray ALP 17.4%
Bulimba Jack Houston ALP 17.8%
Salisbury Doug Sherrington ALP 20.5%
Port Curtis Martin Hanson ALP 31.3% v DLP
CROSSBENCH SEATS (2)
Townsville South Tom Aikens IND 9.2% v ALP
Aubigny Kevin Harrold DLP 13.2% v CP

See also

References

This article is issued from Wikipedia - version of the 7/8/2016. The text is available under the Creative Commons Attribution/Share Alike but additional terms may apply for the media files.