West German federal election, 1980
| | |||||||||||||||||||||||||||||||||||||||||||||||||||||||||||
| |||||||||||||||||||||||||||||||||||||||||||||||||||||||||||
| |||||||||||||||||||||||||||||||||||||||||||||||||||||||||||
|
| |||||||||||||||||||||||||||||||||||||||||||||||||||||||||||
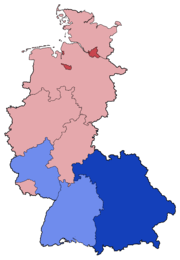
| Party list election results by state: red denotes states where the SPD had the absolute majority of the votes; pink denotes states where the SPD had the plurality of votes; darker blue denotes states where CSU had the absolute majority of the votes; and lighter blue denotes states where CDU had the plurality of votes | |||||||||||||||||||||||||||||||||||||||||||||||||||||||||||
| |||||||||||||||||||||||||||||||||||||||||||||||||||||||||||
 |
| This article is part of a series on the politics and government of Germany |
|
Constitution ("Fundamental Law Code") |
|
| Foreign relations |
Federal elections were held in West Germany on 5 October 1980, to elect members to the Bundestag (parliament) of the Federal Republic of Germany.
Issues and campaign
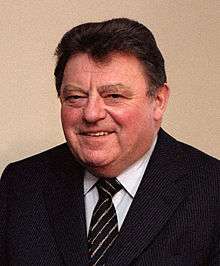
Chancellor Helmut Schmidt of the SPD-FDP coalition wanted to be re-elected. CDU/CSU tried to make their candidate the elected Chancellor, CSU leader Franz Josef Strauß. It was the first time that their candidate was from the CSU. Strauß, immensely popular in Bavaria, found it difficult to appeal to people in other parts of Germany. One important reason for Strauss's unpopularity compared to Federal Chancellor Helmut Schmidt, was his tendency to talk sharply and militantly about his political opponents. Schmidt, by contrast, was still seen by many West German voters as a moderate and practical manager and doer, who focused on getting concrete political and economic results more than on political rhetoric (see, for example, Erling Bjöl, Grimberg's History of the Nations, volume 22: From Peace to the Cold War, Helsinki: WSOY, 1984, pages 495, 497–499; Bjöl, Grimberg's History of the Nations, volume 23: The Rich West, Helsinki: WSOY, 1985, pages 353–356; Dennis L. Bark and David R. Gress, A History of West Germany: Volume 2: Democracy and Its Discontents, 1963–1988, "The Era of Macher [Doer]," London, UK: Basil Blackwell, 1989).
Results
| Parties | Constituency | Party list | Total seats | |||||||||||||
|---|---|---|---|---|---|---|---|---|---|---|---|---|---|---|---|---|
| Votes | % | +/− | Seats | +/− | Votes | % | +/− | Seats | +/− | Seats† | +/− | % | ||||
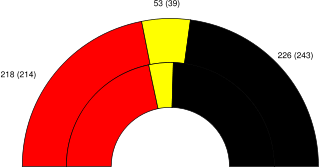
| Social Democratic Party (SPD) | 16,808,861 | 44.5 | +0.8 | 127 | +13 | 16,260,677 | 42.9 | +0.3 | 91 | −9 | 228 | +4 | 43.9 | |||
| Christian Democratic Union (CDU) | 13,467,207 | 35.6 | −2.7 | 81 | −13 | 12,989,200 | 34.2 | −3.8 | 93 | −3 | 185 | −16 | 35.6 | |||
| Free Democratic Party (FDP) | 2,720,480 | 7.2 | +0.8 | 0 | ±0 | 4,030,999 | 10.6 | +2.7 | 53 | +14 | 54 | +14 | 10.4 | |||
| Christian Social Union (CSU) | 3,941,365 | 10.4 | −0.2 | 40 | ±0 | 3,908,459 | 10.3 | −0.3 | 12 | −1 | 52 | −1 | 10.0 | |||
| The Greens | 732,619 | 1.0 | +1.0 | 0 | ±0 | 569,589 | 1.5 | +1.5 | 0 | ±0 | 0 | ±0 | 0 | |||
| German Communist Party (DKP) | 107,158 | 0.3 | −0.2 | 0 | ±0 | 71,600 | 0.2 | −0.1 | 0 | ±0 | 0 | ±0 | 0 | |||
| National Democratic Party (NPD) | – | – | – | – | – | 68,096 | 0.2 | −0.1 | 0 | ±0 | 0 | ±0 | 0 | |||
| Citizens' Party | 507 | 0.0 | +0.0 | 0 | ±0 | 11,256 | 0.0 | +0.0 | 0 | ±0 | 0 | ±0 | 0 | |||
| People's Front Against Reaction, Fascism and War (V) | 7,160 | 0.0 | +0.0 | 0 | ±0 | 9,319 | 0.0 | +0.0 | 0 | ±0 | 0 | ±0 | 0 | |||
| Communist League of West Germany (KBW) | 12,008 | 0.0 | −0.1 | 0 | ±0 | 8,174 | 0.0 | −0.1 | 0 | ±0 | 0 | ±0 | 0 | |||
| European Workers' Party (EAP) | 4,992 | 0.0 | ±0 | 0 | ±0 | 7,666 | 0.0 | ±0 | 0 | ±0 | 0 | ±0 | 0 | |||
| Christian Bavarian People's Party (CBV) | – | – | – | – | – | 3,946 | 0.0 | ±0 | 0 | ±0 | 0 | ±0 | 0 | |||
| DU | 421 | 0.0 | +0.0 | 0 | ±0 | – | – | – | – | – | 0 | ±0 | 0 | |||
| Independent Workers' Party (UAP) | 159 | 0.0 | ±0 | 0 | ±0 | – | – | – | – | – | 0 | ±0 | 0 | |||
| DFP | 96 | 0.0 | +0.0 | 0 | ±0 | – | – | – | – | – | 0 | ±0 | 0 | |||
| Electoral groups and independents | 3,498 | 0.0 | ±0 | 0 | ±0 | – | – | – | – | – | 0 | ±0 | 0 | |||
| Invalid/blank votes | 485,645 | — | — | — | — | 353,115 | — | — | — | — | — | — | — | |||
| Totals | 38,292,176 | 100 | ±0.0 | 248 | ±0 | 38,292,176 | 100 | ±0.0 | 249 | +1 | 519 | +1 | ±0 | |||
| Registered voters/turnout | 43,231,741 | 88.6 | — | — | — | 43,231,741 | 88.6 | — | — | — | — | — | — | |||
| Source: Federal Returning Officer | ||||||||||||||||
- ^† — includes the non-voting delegates for West Berlin (11 CDU, 10 SPD, 1 FDP).
| 228 | 54 | 237 |
| SPD | FDP | CDU/CSU |

Post-election
The coalition between the SPD and the FDP returned to government, with Helmut Schmidt as Chancellor. In 1982, the FDP quit the government, which led to the government's collapse and replacement with a new CDU/CSU – FDP coalition under Helmut Kohl.
References
- ↑ "Voter turnout by election year". Website of the Federal Returning Officer's Office. The Federal Returning Officer. Retrieved 7 November 2014.


