California's 15th congressional district
| California's 15th congressional district | ||
|---|---|---|
.tif.png) | ||
| Current Representative | Eric Swalwell (D–Dublin) | |
| Ethnicity | 37.5% White, 6.9% Black, 30.1% Asian, 23.4% Hispanic, 2.1[1]% other | |
| Cook PVI | D+16 | |
California's 15th congressional district is a congressional district in the U.S. state of California that covers most of eastern Alameda County including Hayward, Pleasanton, Livermore, Fremont and parts of Contra Costa County, including San Ramon.
The district is currently represented by Democrat Eric Swalwell.
As a result of a redistricting initiative passed during the 2010 election, the northern parts of the former 15th district became part of the new 17th District, the middle parts were merged with most of the former 14th District to create the new 18th district, and the southern parts were merged with most of the former 16th District to create the new 19th District; the new 15th district occupies the areas around Union City, Hayward, and Livermore. This area was previously represented by the 13th district. The changes took effect in the 2012 elections.
Election results from statewide races
| Year | U.S. President | U.S. Senator (Class 1) | U.S. Senator (Class 3) | Governor |
|---|---|---|---|---|
| 1992 | Clinton 46.3 - 30.3% | Feinstein 59.3 - 33.4% | Boxer 51.1 - 38.3% | |
| 1994 | [Data unknown/missing. You can help!] | [Data unknown/missing. You can help!] | ||
| 1996 | [Data unknown/missing. You can help!] | |||
| 1998 | [Data unknown/missing. You can help!] | [Data unknown/missing. You can help!] | ||
| 2000 | Gore 56.7 - 37.8%[2] | Feinstein 54.6 - 39.8%[3] | ||
| 2002 | Davis 55.0 - 33.4%[4] | |||
| 2003 | Recall: No 56.0 - 44.0%[5][6] | |||
| Schwarzenegger 40.8 - 37.2% | ||||
| 2004 | Kerry 62.9 - 35.9%[7] | Boxer 64.9 - 30.8%[8] | ||
| 2006 | Feinstein 68.5 - 26.2%[9] | Schwarzenegger 53.6 - 41.3%[10] | ||
| 2008 | Obama 68.4 - 29.7%[11] | |||
| 2010 | Boxer 61.8 - 33.0% | Brown 59.8 - 36.2% |
List of representatives
| Representative | Party | Dates | Notes | Counties |
|---|---|---|---|---|
| District created | March 4, 1933 | |||
 William I. Traeger William I. Traeger |
Republican | March 4, 1933 – January 3, 1935 |
Lost re-election | Los Angeles |
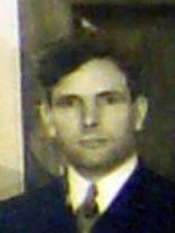 John M. Costello John M. Costello |
Democratic | January 3, 1935 – January 3, 1945 |
Lost re-nomination | |
 Gordon L. McDonough Gordon L. McDonough |
Republican | January 3, 1945 – January 3, 1963 |
Lost re-election | |
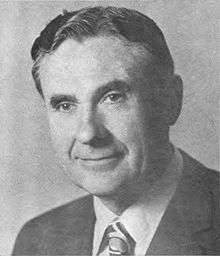 John J. McFall John J. McFall |
Democratic | January 3, 1963 – January 3, 1967 |
Redistricted from the 11th district Redistricted to the 14th district |
San Joaquin, Stanislaus |
| January 3, 1967 – January 3, 1973 |
Northeastern Merced, San Joaquin, Stanislaus | |||
| January 3, 1973 – January 3, 1975 |
Eastern Sacramento, San Joaquin, Stanislaus | |||
 Bernice F. Sisk Bernice F. Sisk |
Democratic | January 3, 1975 – January 3, 1979 |
Redistricted from the 16th district | Western Fresno, Madera, Mariposa, Merced, Stanislaus |
 Tony Coelho Tony Coelho |
Democratic | January 3, 1979 – January 3, 1983 |
Resigned | |
| January 3, 1983 – June 15, 1989 |
Western Fresno, Mariposa, Merced, Stanislaus | |||
| Vacant | June 15, 1989 – September 12, 1989 | |||
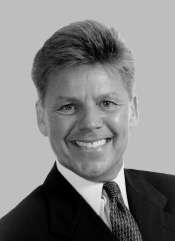 Gary Condit Gary Condit |
Democratic | September 12, 1989 – January 3, 1993 |
Redistricted to the 18th district | |
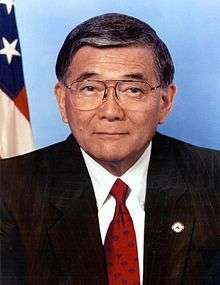 Norman Mineta Norman Mineta |
Democratic | January 3, 1993 – October 10, 1995 |
Redistricted from the 13th district Resigned to accept a position with Lockheed Martin |
Western Santa Clara, northern Santa Cruz |
| Vacant | October 10, 1995 – December 12, 1995 | |||
 Tom Campbell Tom Campbell |
Republican | December 12, 1995 – January 3, 2001 |
Retired to run for U.S. Senate | |
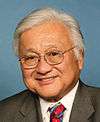 Mike Honda Mike Honda |
Democratic | January 3, 2001 – January 3, 2003 |
||
| January 3, 2003 – January 3, 2013 |
Redistricted to the 17th district | 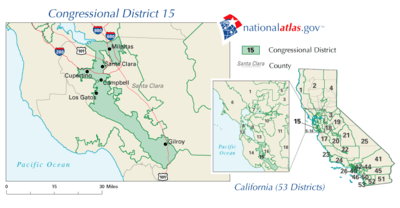 Western/northwestern Santa Clara | ||
 Eric Swalwell Eric Swalwell |
Democratic | January 3, 2013 – present |
East Bay including Hayward and Dublin | |
Election results
|
1932 • 1934 • 1936 • 1938 • 1940 • 1942 • 1944 • 1946 • 1948 • 1950 • 1952 • 1954 • 1956 • 1958 • 1960 • 1962 • 1964 • 1966 • 1968 • 1970 • 1972 • 1974 • 1976 • 1978 • 1980 • 1982 • 1984 • 1986 • 1988 • 1989 (Special) • 1990 • 1992 • 1994 • 1995 (Special) • 1996 • 1998 • 2000 • 2002 • 2004 • 2006• 2008• 2010• 2012• 2014 |
1932
| Party | Candidate | Votes | % | ||
|---|---|---|---|---|---|
| Republican | William I. Traeger | 67,390 | 52.8 | ||
| Democratic | John M. Costello | 57,518 | 45.1 | ||
| No party | Errol Shour (write-in) | 2,721 | 2.1% | ||
| Total votes | 127,663 | 100.0 | |||
| Voter turnout | % | ||||
| Republican win (new seat) | |||||
1934
| Party | Candidate | Votes | % | |||
|---|---|---|---|---|---|---|
| Democratic | John M. Costello | 67,247 | 50.5 | |||
| Republican | William I. Traeger (incumbent) | 65,858 | 49.5 | |||
| Total votes | 133,161 | 100.0 | ||||
| Voter turnout | % | |||||
| Democratic gain from Republican | ||||||
1936
| Party | Candidate | Votes | % | |
|---|---|---|---|---|
| Democratic | John M. Costello (incumbent) | 99,107 | 69.0 | |
| Republican | Ernest Sawyer | 44,559 | 31.0 | |
| Total votes | 143,718 | 100.0 | ||
| Voter turnout | % | |||
| Democratic hold | ||||
1938
| Party | Candidate | Votes | % | |
|---|---|---|---|---|
| Democratic | John M. Costello (incumbent) | 83,086 | 60.1 | |
| Republican | O. D. Thomas | 51,483 | 37.3 | |
| Communist | Emil Freed | 2,951 | 2.1 | |
| Total votes | 138,132 | 100.0 | ||
| Voter turnout | % | |||
| Democratic hold | ||||
1940
| Party | Candidate | Votes | % | |
|---|---|---|---|---|
| Democratic | John M. Costello (incumbent) | 94,435 | 56.2 | |
| Republican | Norris Nelson | 71,667 | 42.6 | |
| Communist | Emil Freed | 2,004 | 1.2 | |
| Total votes | 168,155 | 100.0 | ||
| Voter turnout | % | |||
| Democratic hold | ||||
1942
| Party | Candidate | Votes | % | |
|---|---|---|---|---|
| Democratic | John M. Costello (incumbent) | 88,798 | 86.1 | |
| Prohibition | B. Tarkington Dowden | 10,185 | 9.9 | |
| Communist | Philip Gardner | 3,989 | 3.9 | |
| Total votes | 103,094 | 100.0 | ||
| Voter turnout | % | |||
| Democratic hold | ||||
1944
| Party | Candidate | Votes | % | |||
|---|---|---|---|---|---|---|
| Republican | Gordon L. McDonough | 100,305 | 56.6 | |||
| Democratic | Hal Styles | 73,655 | 41.6 | |||
| Prohibition | Johannes Nielson-Lange | 2,694 | 1.5 | |||
| Total votes | 177,081 | 100.0 | ||||
| Voter turnout | % | |||||
| Republican gain from Democratic | ||||||
1946
| Party | Candidate | Votes | % | |
|---|---|---|---|---|
| Republican | Gordon L. McDonough (inc.) | 106,020 | 99.4 | |
| Voter turnout | % | |||
| Republican hold | ||||
1948
| Party | Candidate | Votes | % | |
|---|---|---|---|---|
| Republican | Gordon L. McDonough (inc.) | 131,933 | 83.0 | |
| Progressive | Maynard Omerberg | 27,007 | 17.0 | |
| Total votes | 159,031 | 100.0 | ||
| Voter turnout | % | |||
| Republican hold | ||||
1950
| Party | Candidate | Votes | % | |
|---|---|---|---|---|
| Republican | Gordon L. McDonough (inc.) | 112,704 | 87.1 | |
| Progressive | Jeanne Cole | 16,559 | 12.8 | |
| Total votes | 129,352 | 100.0 | ||
| Voter turnout | % | |||
| Republican hold | ||||
1952
| Party | Candidate | Votes | % | |
|---|---|---|---|---|
| Republican | Gordon L. McDonough (inc.) | 142,545 | 99.7 | |
| Voter turnout | % | |||
| Republican hold | ||||
1954
| Party | Candidate | Votes | % | |
|---|---|---|---|---|
| Republican | Gordon L. McDonough (inc.) | 77,651 | 56.9 | |
| Democratic | Frank O'Sullivan | 58,785 | 43.1 | |
| Total votes | 136,445 | 100.0 | ||
| Voter turnout | % | |||
| Republican hold | ||||
1956
| Party | Candidate | Votes | % | |
|---|---|---|---|---|
| Republican | Gordon L. McDonough (inc.) | 97,182 | 57.9 | |
| Democratic | Emery Petty | 70,681 | 42.1 | |
| Total votes | 167,865 | 100.0 | ||
| Voter turnout | % | |||
| Republican hold | ||||
1958
| Party | Candidate | Votes | % | |
|---|---|---|---|---|
| Republican | Gordon L. McDonough (inc.) | 77,267 | 52.0 | |
| Democratic | Emery Petty | 71,192 | 48.0 | |
| Total votes | 148,482 | 100.0 | ||
| Voter turnout | % | |||
| Republican hold | ||||
1960
| Party | Candidate | Votes | % | |
|---|---|---|---|---|
| Republican | Gordon L. McDonough (inc.) | 89,234 | 51.3 | |
| Democratic | Norman Martell | 84,650 | 48.5 | |
| Total votes | 174,035 | 100.0 | ||
| Voter turnout | % | |||
| Republican hold | ||||
1962
| Party | Candidate | Votes | % | |
|---|---|---|---|---|
| Democratic | John J. McFall (incumbent) | 97,322 | 70 | |
| Republican | Clifford B. Bull | 41,726 | 30 | |
| Total votes | 139,048 | 100 | ||
| Voter turnout | % | |||
| Democratic hold | ||||
1964
| Party | Candidate | Votes | % | |
|---|---|---|---|---|
| Democratic | John J. McFall (incumbent) | 109,560 | 70.9 | |
| Republican | Kenneth Gibson | 44,977 | 29.1 | |
| Total votes | 154,537 | 100.0 | ||
| Voter turnout | % | |||
| Democratic hold | ||||
1966
| Party | Candidate | Votes | % | |
|---|---|---|---|---|
| Democratic | John J. McFall (incumbent) | 81,733 | 57 | |
| Republican | Sam Van Dyken | 61,550 | 43 | |
| Total votes | 143,283 | 100 | ||
| Voter turnout | % | |||
| Democratic hold | ||||
1968
| Party | Candidate | Votes | % | |
|---|---|---|---|---|
| Democratic | John J. McFall (incumbent) | 85,761 | 53.8 | |
| Republican | Sam Van Dyken | 73,685 | 46.2 | |
| Total votes | 159,446 | 100.0 | ||
| Voter turnout | % | |||
| Democratic hold | ||||
1970
| Party | Candidate | Votes | % | |
|---|---|---|---|---|
| Democratic | John J. McFall (incumbent) | 98,442 | 63.1 | |
| Republican | Sam Van Dyken | 55,546 | 35.6 | |
| American Independent | Francis E. "Gill" Gillings | 1,994 | 1.3 | |
| Total votes | 155,982 | 100.0 | ||
| Voter turnout | % | |||
| Democratic hold | ||||
1972
| Party | Candidate | Votes | % | |
|---|---|---|---|---|
| Democratic | John J. McFall (incumbent) | 145,273 | 100.0 | |
| Voter turnout | % | |||
| Democratic hold | ||||
1974
| Party | Candidate | Votes | % | |
|---|---|---|---|---|
| Democratic | Bernice F. Sisk (incumbent) | 80,205 | 72 | |
| Republican | Carol Harner | 31,361 | 28 | |
| Total votes | 111,566 | 100 | ||
| Voter turnout | % | |||
| Democratic hold | ||||
1976
| Party | Candidate | Votes | % | |
|---|---|---|---|---|
| Democratic | Bernice F. Sisk (incumbent) | 92,735 | 72.2 | |
| Republican | Carol Harner | 35,700 | 27.8 | |
| Total votes | 128,435 | 100.0 | ||
| Voter turnout | % | |||
| Democratic hold | ||||
1978
| Party | Candidate | Votes | % | |
|---|---|---|---|---|
| Democratic | Tony Coelho | 75,212 | 60.1 | |
| Republican | Chris Patterakis | 49,914 | 39.9 | |
| Total votes | 125,126 | 100.0 | ||
| Voter turnout | % | |||
| Democratic hold | ||||
1980
| Party | Candidate | Votes | % | |
|---|---|---|---|---|
| Democratic | Tony Coelho (incumbent) | 108,072 | 71.8 | |
| Republican | Ron Schwartz | 37,895 | 25.2 | |
| Libertarian | Michael L. Pullen | 4,524 | 3.0 | |
| Total votes | 150,491 | 100.0 | ||
| Voter turnout | % | |||
| Democratic hold | ||||
1982
| Party | Candidate | Votes | % | |
|---|---|---|---|---|
| Democratic | Tony Coelho (incumbent) | 86,022 | 63.7 | |
| Republican | Ed Bates | 45,948 | 34.0 | |
| Libertarian | Stephen L. Gerringer | 3,073 | 2.3 | |
| Total votes | 135,043 | 100.0 | ||
| Voter turnout | % | |||
| Democratic hold | ||||
1984
| Party | Candidate | Votes | % | |
|---|---|---|---|---|
| Democratic | Tony Coelho (incumbent) | 109,590 | 65.5 | |
| Republican | Carol Harner | 54,730 | 32.7 | |
| Libertarian | Richard M. Harris | 3,086 | 1.8 | |
| Total votes | 167,406 | 100.0 | ||
| Voter turnout | % | |||
| Democratic hold | ||||
1986
| Party | Candidate | Votes | % | |
|---|---|---|---|---|
| Democratic | Tony Coelho (incumbent) | 93,600 | 71.0 | |
| Republican | Carol Harner | 35,793 | 27.2 | |
| Libertarian | Richard M. Harris | 2,382 | 1.8 | |
| Total votes | 131,775 | 100.0 | ||
| Voter turnout | % | |||
| Democratic hold | ||||
1988
| Party | Candidate | Votes | % | |
|---|---|---|---|---|
| Democratic | Tony Coelho (incumbent) | 118,710 | 69.8 | |
| Republican | Carol Harner | 47,957 | 28.2 | |
| Libertarian | Richard M. Harris | 3,526 | 2.1 | |
| Total votes | 170,193 | 100.0 | ||
| Total votes | 70,753 | 41.6 | ||
| Voter turnout | % | |||
| Democratic hold | ||||
1989 (Special)
| Party | Candidate | Votes | % | |
|---|---|---|---|---|
| Democratic | Gary Condit | ' | 57.1 | |
| Republican | Claire L. Berryhill | 35.0 | ||
| Republican | Robert J. Weimer | 3.3 | ||
| Republican | Cliff Burris | 2.6 | ||
| Libertarian | Roy Shrimp | 0.9 | ||
| Republican | Chris Patterakis | 0.4 | ||
| Republican | David M. "Dave" Williams | 0.4 | ||
| Republican | Jack E. McCoy | 0.2 | ||
| Total votes | ' | 100.0 | ||
| Voter turnout | % | |||
| Democratic hold | ||||
1990
| Party | Candidate | Votes | % | |
|---|---|---|---|---|
| Democratic | Gary Condit (incumbent) | 97,147 | 66.2 | |
| Republican | Cliff Burris | 49,634 | 33.8 | |
| Total votes | 146,781 | 100.0 | ||
| Voter turnout | % | |||
| Democratic hold | ||||
1992
| Party | Candidate | Votes | % | |
|---|---|---|---|---|
| Democratic | Norm Mineta (incumbent) | 168,617 | 63.5 | |
| Republican | Robert Wick | 82,875 | 31.2 | |
| Libertarian | Duggan Dieterly | 13,293 | 5.0 | |
| No party | Futrell (write-in) | 585 | 0.2% | |
| Total votes | 265,370 | 100.0 | ||
| Voter turnout | % | |||
| Democratic hold | ||||
1994
| Party | Candidate | Votes | % | |
|---|---|---|---|---|
| Democratic | Norm Mineta (incumbent) | 119,921 | 59.90 | |
| Republican | Robert Wick | 80,266 | 40.09 | |
| No party | Liu (write-in) | 17 | 0.01% | |
| Total votes | 200,204 | 100.0 | ||
| Voter turnout | % | |||
| Democratic hold | ||||
1995 (Special)
| Party | Candidate | Votes | % | |||
|---|---|---|---|---|---|---|
| Republican | Tom Campbell | 54,372 | 58.85 | |||
| Democratic | Jerry Estruth | 33,051 | 35.77 | |||
| Independent | Linh Kieu Dao | 4,922 | 5.33 | |||
| Reform | Connor Vlakancic (write-in) | 42 | 0.05 | |||
| Total votes | 92,387 | 100.00 | ||||
| Voter turnout | % | |||||
| Republican gain from Democratic | ||||||
1996
| Party | Candidate | Votes | % | |
|---|---|---|---|---|
| Republican | Tom Campbell (incumbent) | 132,737 | 58.6 | |
| Democratic | Dick Lane | 79,048 | 34.9 | |
| Reform | Valli Sharpe-Geisler | 6,230 | 2.7 | |
| Libertarian | Ed Wimmers | 5,481 | 2.4 | |
| Natural Law | Bruce Currivan | 3,372 | 1.4 | |
| Republican | Linh Dao (write-in) | 9 | 0.0 | |
| Republican | Connor Vlakancic (write-in) | 9 | 0.0 | |
| Total votes | 226,886 | 100.0 | ||
| Voter turnout | % | |||
| Republican hold | ||||
1998
| Party | Candidate | Votes | % | |
|---|---|---|---|---|
| Republican | Tom Campbell (incumbent) | 111,876 | 60.54 | |
| Democratic | Dick Lane | 70,059 | 37.91 | |
| Natural Law | Frank Strutner | 2,843 | 1.54 | |
| Republican | Constant Vlakancic (write-in) | 8 | 0.00 | |
| Total votes | 184,786 | 100.0 | ||
| Voter turnout | % | |||
| Republican hold | ||||
2000
| Party | Candidate | Votes | % | |||
|---|---|---|---|---|---|---|
| Democratic | Mike Honda | 128,545 | 54.3 | |||
| Republican | Jim Cunneen | 99,866 | 42.2 | |||
| Libertarian | Ed Wimmers | 4,820 | 2.0 | |||
| Natural Law | Douglas C. Gorney | 3,591 | 1.5 | |||
| No party | Phillip Kronzer (write-in) | 82 | 0.0% | |||
| Total votes | 236,904 | 100.0 | ||||
| Voter turnout | % | |||||
| Democratic gain from Republican | ||||||
2002
| Party | Candidate | Votes | % | |
|---|---|---|---|---|
| Democratic | Mike Honda (incumbent) | 87,482 | 65.8 | |
| Republican | Linda Rae Hermann | 41,251 | 31.0 | |
| Libertarian | Jeff Landauer | 4,289 | 3.2 | |
| Total votes | 133,022 | 100.0 | ||
| Voter turnout | % | |||
| Democratic hold | ||||
2004
| Party | Candidate | Votes | % | |
|---|---|---|---|---|
| Democratic | Mike Honda (incumbent) | 154,385 | 72.1 | |
| Republican | Raymond Chukwu | 59,953 | 27.9 | |
| Total votes | 214,338 | 100.0 | ||
| Voter turnout | % | |||
| Democratic hold | ||||
2006
| Party | Candidate | Votes | % | |
|---|---|---|---|---|
| Democratic | Mike Honda (incumbent) | 115,532 | 72.4 | |
| Republican | Raymond Chukwu | 44,186 | 27.6 | |
| Total votes | 186,718 | 100.0 | ||
| Voter turnout | % | |||
| Democratic hold | ||||
2008
| Party | Candidate | Votes | % | |
|---|---|---|---|---|
| Democratic | Mike Honda (incumbent) | 170,977 | 71.66 | |
| Republican | Joyce Stoer Cordi | 55,489 | 23.26 | |
| Green | Peter Myers | 12,123 | 5.08 | |
| Total votes | 238,589 | 100.0 | ||
| Voter turnout | % | |||
| Democratic hold | ||||
2010
| Party | Candidate | Votes | % | |
|---|---|---|---|---|
| Democratic | Mike Honda (incumbent) | 126,147 | 67.60 | |
| Republican | Scott Kirkland | 60,468 | 32.40 | |
| Total votes | 186,615 | 100.00 | ||
| Voter turnout | % | |||
| Democratic hold | ||||
2012
| Party | Candidate | Votes | % | |
|---|---|---|---|---|
| Democratic | Eric Swalwell | 120,388 | 52.1 | |
| Democratic | Pete Stark (incumbent) | 110,646 | 47.9 | |
| Total votes | 231,034 | 100.00 | ||
| Democratic hold | ||||
2014
| Party | Candidate | Votes | % | |
|---|---|---|---|---|
| Democratic | Eric Swalwell (incumbent) | 99,756 | 69.8 | |
| Republican | Hugh Bussell | 43,150 | 30.2 | |
| Total votes | 142,906 | 100.00 | ||
| Democratic hold | ||||
Living former Members
As of April 2015, there are five living former members of the U.S. House of Representatives from this district.
| Representative | Term in office | Date of birth (and age) |
|---|---|---|
| Tony Coelho | 1979 - 1989 | June 15, 1942 |
| Gary Condit | 1989 - 1993 | April 21, 1948 |
| Norman Mineta | 1993 - 1995 | November 12, 1931 |
| Tom Campbell | 1995 - 2001 | August 14, 1952 |
| Mike Honda | 2001 - 2013 | June 27, 1941 |
See also
References
- ↑ "California election results - 2012 election". Los Angeles Times. Retrieved February 24, 2013.
- ↑ Statement of Vote (2000 President)
- ↑ Statement of Vote (2000 Senator)
- ↑ Statement of Vote (2002 Governor)
- ↑ Statement of Vote (2003 Recall Question)
- ↑ Statement of Vote (2003 Governor)
- ↑ Statement of Vote (2004 President)
- ↑ Statement of Vote (2004 Senator)
- ↑ Statement of Vote (2006 Senator)
- ↑ Statement of Vote (2006 Governor)
- ↑ (2008 President)
- ↑ 1932 election results
- ↑ 1934 election results
- ↑ 1936 election results
- ↑ 1938 election results
- ↑ 1940 election results
- ↑ 1942 election results
- ↑ 1944 election results
- ↑ 1946 election results
- ↑ 1948 election results
- ↑ 1950 election results
- ↑ 1952 election results
- ↑ 1954 election results
- ↑ 1956 election results
- ↑ 1958 election results
- ↑ 1960 election results
- ↑ 1962 election results
- ↑ 1964 election results
- ↑ 1966 election results
- ↑ 1968 election results
- ↑ 1970 election results
- ↑ 1972 election results
- ↑ 1974 election results
- ↑ 1976 election results
- ↑ 1978 election results
- ↑ 1980 election results
- ↑ 1982 election results
- ↑ 1984 election results
- ↑ 1986 election results
- ↑ 1988 election results
- ↑ 1989 special election results
- ↑ 1990 election results
- ↑ 1992 election results
- ↑ 1994 election results
- ↑ 1995 special election results
- ↑ 1996 election results
- ↑ 1998 election results
- ↑ 2000 election results
- ↑ 2002 election results Archived February 3, 2009, at the Wayback Machine.
- ↑ 2004 election results
- ↑ 2006 election results Archived November 27, 2008, at the Wayback Machine.
- ↑ 2008 election results
- ↑ 2010 election results
- ↑ 2012 general election results Archived October 19, 2013, at the Wayback Machine.
- ↑ House of Representatives District 15 - Districtwide Results
External links
- GovTrack.us: California's 15th congressional district
- RAND California Election Returns: District Definitions
- California Voter Foundation map - CD15
Coordinates: 37°39′20″N 121°50′06″W / 37.65556°N 121.83500°W
