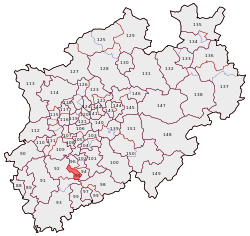
Cologne II (electoral district)

Cologne II (German: Köln II) is one of the four electoral districts (German: Wahlkreis) covering the city of Cologne in the German Bundestag. Part of the state of North Rhine-Westphalia, the constituency elects one representative under the mixed member proportional representation (MMP) system. Under the current constituency numbering system, it is designated as constituency 95.
Boundaries
Covering the south western quarter of the city of Cologne, since 1980 the constituency has contained the entirety of two of the city's nine districts: Rodenkirchen and Lindenthal. Since 2002, it has also stretched into the city centre to include two of the five areas of the Innenstadt district: Altstadt-Süd und Neustadt-Süd. The latter area includes about half of Cologne's old and new town areas.[1] and was transferred from the Cologne I district when the number of constituencies in Cologne was reduced from four whole constituencies to three and half of a fourth at the 2002 election.
2009 election
| Party | Constituency results | List results | ||||||
|---|---|---|---|---|---|---|---|---|
| Candidate | Votes | % share | +/- | Votes | % share | +/- | ||
| Christian Democratic Union | Michael Paul | 59,710 | 34.9 | +0.3 | 48,545 | 28.3 | -1.1 | |
| Social Democratic Party of Germany | Lale Akgün | 55,471 | 32.4 | -11.4 | 37.665 | 22.0 | -11.2 | |
| Alliance '90/The Greens | Volker Beck | 26,614 | 15.5 | +5.6 | 34,040 | 19.8 | +3.2 | |
| Free Democratic Party | Werner Hoyer | 18,455 | 10.8 | +3.1 | 32,663 | 19.0 | +4.7 | |
| The Left Party.PDS | Matthias Birkwald | 9,550 | 5.6 | +2.1 | 12,138 | 7.1 | +2.3 | |
| National Democratic Party of Germany | Erwine Lehmig | 1,131 | 0.7 | +0.1 | 809 | 0.5 | +0.1 | |
| Pirate Party | N/A | N/A | N/A | N/A | 3,237 | 1.9 | N/A | |
| Others | 2,459 | 1.1 | N/A | |||||
Source:[2]
District representatives
The District's MPs have been:
| Year | Name | Party | First vote % |
|---|---|---|---|
| 2009 | Michael Paul | CDU | 34.9% |
| 2005 | Lale Akgün | SPD | 43.8% |
| 2002 | Lale Akgün | SPD | 43.9% |
| 1998 | Anke Fuchs | SPD | 44.5% |
| 1994 | Heribert Blens | CDU | 43.2% |
| 1990 | Heribert Blens | CDU | 41.9% |
| 1987 | Heribert Blens | CDU | 45.2% |
| 1983 | Heribert Blens | CDU | 50.2% |
| 1980 | Anke Fuchs | SPD | 44.0% |
| 1976 | Katharina Focke | SPD | 47.7% |
| 1972 | Katharina Focke | SPD | 54.7% |
| 1969 | Katharina Focke | SPD | 50.9% |
| 1965 | Carl Hesberg | CDU | 50.0% |
| 1961 | Carl Hesberg | CDU | 50.3% |
| 1957 | Fritz Hellwig | CDU | 60.6% |
| 1953 | Hermann Pünder | CDU | 54.5% |
| 1949 | Hermann Pünder | CDU | 44.9% |
References
- ↑ Electoral boundaries, bundeswahlleiter.de, accessed 12 June 2012
- ↑ 2009 constituency results, bundeswahlleiter.de, accessed 13 June 2012