Comparison of imports vs exports of the United States
The Following is a comparative list of the balance of trade for imports vs exports of the United States in 2015 ($Billions of Dollars).[1][2]

| Product | Imports | Exports | Difference +/- |
|---|---|---|---|
| Electronic equipment | $332.9 | $169.8 | -$163.1 |
| Machines, engines, pumps | $329.3 | $205.8 | -$123.5 |
| Vehicles | $283.8 | $127.1 | -$146.7 |
| Fuel | $201.2 | $106.1 | -$95.1 |
| Pharmaceuticals | $86.1 | $47.3 | -$38.8 |
| Medical, technical equipment | $78.3 | $83.4 | +$5.1 |
| Furniture, lighting, signs | $61.2 | $11.5 | -$49.7 |
| Gems, precious metals | $60.2 | $58.7 | -$1.5 |
| Organic chemicals | $52.1 | $38.8 | -$13.3 |
| Plastics | $50.2 | $60.3 | +$10.1 |
| Aircraft/Spacecraft | $35.3 | $131.1 | +$95.8 |
| Total of all trade | $2.309 Trillion | $1.51 Trillion | -$799 |

| Country | Exports | Imports | Trade Deficit |
|---|---|---|---|
| |
123,676 | 446,754 | 343,078 |
| |
276,142 | 418,754 | 142,059 |
| |
49,363 | 123,260 | 73,897 |
| |
66,827 | 134,004 | 67,117 |
| |
240,249 | 294,074 | 53,825 |
| |
312,421 | 347,798 | 35,377 |
| |
18,705 | 47,041 | 28,336 |
| |
7,806 | 33,956 | 26,150 |
| |
16,968 | 42,115 | 25,147 |
| |
44,471 | 69,518 | 25,047 |
| |
21,608 | 45,244 | 23,636 |
| |
13,068 | 30,420 | 17,352 |
| |
31,301 | 46,874 | 15,573 |
| |
11,810 | 27,123 | 15,313 |
| |
26,670 | 40,581 | 13,911 |
| |
22,176 | 31,191 | 9,015 |
| |
15,083 | 22,962 | 7,879 |
| |
53,823 | 54,392 | 569 |


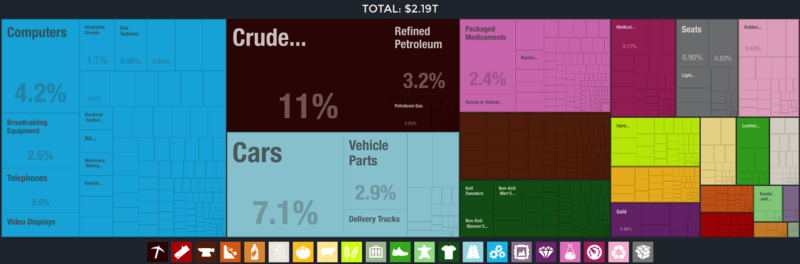
United States imports 2014. atlas.media.mit.edu

United States exports 2014. atlas.media.mit.edu
See also
- List of exports of the United States
- List of the largest trading partners of the United States
- Value added tax trade criticism
- Balance of trade in the United States
References
This article is issued from Wikipedia - version of the 12/3/2016. The text is available under the Creative Commons Attribution/Share Alike but additional terms may apply for the media files.