Data structure diagram

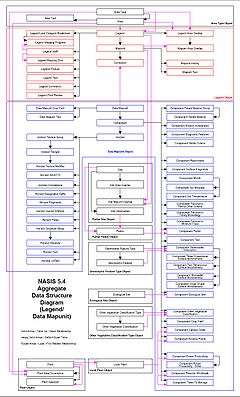
Data structure diagram (DSD) is a diagram of the conceptual data model which documents the entities and their relationships, as well as the constraints that connect to them.
The basic graphic notation elements of DSDs are boxes which represent entities.The arrow symbol represents relationships. Data structure diagrams are most useful for documenting complex data entities.
Overview

Data Structure Diagram is a diagram type that is used to depict the structure of data elements in the data dictionary. The data structure diagram is a graphical alternative to the composition specifications within such data dictionary entries.[1]
The data structure diagrams is a predecessor of the entity-relationship model (E-R model). In DSDs, attributes are specified inside the entity boxes rather than outside of them, while relationships are drawn as boxes composed of attributes which specify the constraints that bind entities together. DSDs differ from the E-R model in that the E-R model focuses on the relationships between different entities, whereas DSDs focus on the relationships of the elements within an entity.
There are several styles for representing data structure diagrams, with the notable difference in the manner of defining cardinality. The choices are between arrow heads, inverted arrow heads (crow's feet), or numerical representation of the cardinality.
Bachman diagram

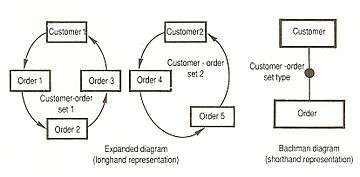
A Bachman diagram is a certain type of data structure diagram,[2] and is used to design the data with a network or relational "logical" model, separating the data model from the way the data is stored in the system. The model is named after database pioneer Charles Bachman, and mostly used in computer software design.
In a relational model, a relation is the cohesion of attributes that are fully and not transitive functional dependent of every key in that relation. The coupling between the relations is based on accordant attributes. For every relation, a rectangle has to be drawn and every coupling is illustrated by a line that connects the relations. On the edge of each line, arrows indicate the cardinality. We have 1-to-n, 1-to-1 and n-to-n. The latter has to be avoided and must be replaced by two (or more) 1-to-n couplings.
See also
| Wikimedia Commons has media related to Data Structure Diagrams. |
References
- ↑ Data Integration Glossary, U.S. Department of Transportation, August 2001.
- ↑ IRS Resources. Part 2. Information Technology, Chapter 5. Systems Development, Section 13. Database Design Techniques and Deliverables. Retrieved 2 July 2009.
Further reading
- Charles W. Bachman. Data structure diagrams. Data Base, 1969, 1(2):4–10.
- Tom DeMarco. Structured Analysis and System Specification. ISBN 0-13-854380-1. Prentice Hall. 11 May 1979.
- Edward Yourdon. Modern Structured Analysis. ISBN 0-13-598624-9. Prentice Hall. 1 August 1988; now available as the Structured Analysis Wiki.