Fed model

The "Fed model" is a theory of equity valuation that has found broad application in the investment community. The model compares the stock market’s earnings yield (E/P) to the yield on long-term government bonds. In its strongest form the Fed model states that bond and stock market are in equilibrium, and fairly valued, when the one-year forward-looking earnings yield equals the 10-year Treasury note yield :
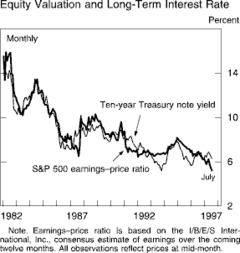
The model is often used as a simple tool to measure attractiveness of equity, and to help allocating funds between equity and bonds. When for example the equity earnings yield is above the government bond yield, investors should shift funds from bonds into equity. The Fed model was so named by Ed Yardeni,[1][2] at Deutsche Morgan Grenfell, based on a statement made in the Humphrey-Hawkins report of July 22, 1997 issued by the Federal Reserve that warned:
- “…changes in this ratio [P/E of the S&P 500 index] have often been inversely related to changes in the long-term Treasury yields, but this year's stock price gains were not matched by a significant net decline in interest rates. As a result, the yield on ten-year Treasury notes now exceeds the ratio of twelve-month-ahead earnings to prices by the largest amount since 1991, when earnings were depressed by the economic slowdown.”
The Fed model was never officially endorsed by the Fed, but former Fed chairman Alan Greenspan[3] seemed to make reference to it in his memoirs: “The decline of real (inflation adjusted) long-term interest rates that has occurred in the last two decades has been associated with rising price-to-earnings ratios for stocks, real estate, and in fact all income-earnings assets.” A bond yield versus equity yield comparison has been used in practice long before the Fed published the graph and Yardeni gave it a name. A variant of this, first the expected AAA bond yield from the Blue Chip survey versus the forward-earnings yield on the S&P 500, and then later versus the 10-year Treasury was developed by Dirk van Dijk at I/B/E/S in the mid-1980s.
Support for the Fed model
While not unanimous, there is broad consensus in the non-academic investing community that the basic comparison underlying the Fed model is valid. A number of arguments are listed by different authors in favor of the Fed model:
Competing assets argument
Stocks and bonds are competing asset classes for investors. When stocks yield more than bonds, investors are better off investing in stocks. When funds flow from bonds into stocks on a large scale, the yield on bonds should increase and the yield on stocks decrease, until the Fed model equilibrium is reached.
Present value
Another argument often mentioned in favor of the Fed model is the present value of stocks should be equal to the sum of its discounted future cash flows. The government bond rate can be seen as a proxy for the risk-free rate. When the government bond rate falls, the discount rate falls, and the present value rises. And this implies that when interest rates fall, E/P also falls.
Historical data
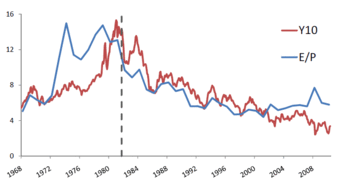
One of the most compelling arguments in favor of the Fed model is the almost 30 years of data from the S&P 500 index showing a high correlation between the two parameters. For example, Salomons[4] shows a correlation of 75% over the 1995–2002 period. However, over the 1881–2002 period the correlation was only 19% and in recent years the correlation has broken down completely.[5]
Users
MoneyWeek (April 28, 2010) argued that
- “The Fed model matters because important people use it. Analysts across the board, from JP Morgan, to ING, to Prudential – I could go on and on – use the Fed model in their calculations. […] The fact is, influential market players embrace the Fed model. Whether they truly believe in it or not is immaterial. The net result is that the Fed model is a significant valuation tool which prominent investors use to check whether they should be buying stocks or bonds. And when those inflection points come about, markets move. Because when the advocates say it's time to buy, a wave of trading orders are placed.”
Inflation and money illusion
Clifford Asness[6] argues that investors actually set stock market P/Es based on nominal interest rates (see also criticism below) but that they do so in error. By confusing real and nominal investors suffer from ‘money illusion’. Asness ‘fights the Fed model’ as a normative model but acknowledges that the model has certain descriptive validity and as a positive model cannot simply be dismissed. Other authors see inflation as the driver behind the Fed model but hypothesize it is not investor stupidity but accounting rules[7] or investor risk aversion during times of inflation[8] that causes the Fed model equilibrium.
Criticism
Criticism on the Fed model has been harsh, and a number of papers with creative titles were published by academia such as "The fed model: The bad, the worse, and the ugly" and "Fight the FED model". Academics have concluded that the model is inconsistent with rational valuation of the stock market.
Lack of theoretical support
The competing asset argument listed above argues that only when stocks have the same yield as government bonds, both asset classes are equally attractive to investors. But the earnings yield (E/P) of a stock does not describe what an investor actually receives as not all earnings are paid out to the investor. And how do corporate bonds (with a yield above the government bond yield) fit into this picture? A number of assumptions need to be made to go from the constant growth dividend discount model to the Fed model. Estrada starts with the Gordon growth model[9]
where P is the current price and D the current dividend, G the expected long-term growth rate, the risk free rate (10-year treasury notes) and RP the equity risk premium. If one now assumes that 100% of the earnings are paid as dividend (D=E), the growth rate is equal to zero, and the equity risk premium is also equal to zero, one gets the Fed model: E/P=. The three assumptions seem unrealistic at best. It is also pointed out that the Fed model compares a real magnitude (E/P) with a nominal interest rate.[6][10][11] Inflation should affect the bond yield, but not the earnings yield.
Data selection and international markets
The Fed model equilibrium was only observed in one market, and for a limited time window. More specifically, the relationship is observed for the S&P 500 index between ~1980 and ~2005 but data outside of this time window, or in different international markets do not show the same pattern. The correlation between earnings yield and government bond yields was only 19% over the 1881–2002 period.[4] Over the period from 1999 to 2010 was reported to be –0.80 with statistical significance . The Fed model equilibrium specifically seemed to break down during the height of the financial crisis in 2008, when the yield on 10-year Treasuries reached an all-time low at 2.4% whereas the S&P 500 earnings yield reached a 20-year-high at more than 8%, a gap of 6 percentage points. And a study of international data showed that the Fed model equilibrium only shows up in 2 out of 20 evaluated international markets.[9] It seems that the empirical support for the Fed model is then based on carefully chosen and limited evidence.
Lack of predictive power
If the Fed model is indeed an equity valuation theory with descriptive validity, it should be able to identify over-valued and under-valued assets. But it turns out that the Fed model has no power to forecast long term stock returns. Traditional value investing methods using only the market's P/E have significantly more efficacy than the Fed model.[6]
As an example Tom Lauricella applied the Fed model to S&P500 index on January 19, 2008.[12] He writes:
- With the past week's downturn, stocks in the Standard and Poor's 500-stock index are trading at 13 times their expected earnings for 2008. Last June, when the S&P index was 12% higher than it is now, stocks were priced at 14.2 times this year's earnings. Meanwhile, with a U.S. recession now widely expected and the Federal Reserve thought likely to cut short-term rates further, U.S. Treasury yields have fallen sharply. The 10-year Treasury note is yielding 3.64%, its lowest level since July 2003, and down from 3.81% a week ago.
Thus S&P500 forward earning yield (1/13=7.69%) is higher than 10-year Treasury note yield (3.64%), suggesting S&P500 is significantly undervalued. However, over the next twelve months, the S&P500 index fell from 1,325.19 (January 18, 2008) to 805.22 points (January 20, 2009), a drop of more than 39%.
Is the Fed model mis-specified?
The Fed model equilibrium remains an enigma. On one hand 30 years of data is available that shows how S&P earnings yield and 10-year government bond yield move in tandem. On the other hand, there is no theoretical foundation to explain the relationship, and the best explanation academics came up with is that investors collectively suffer from 'money illusion'. A number of questions remain unanswered. Why was the relationship observed in the US and not in most other international markets?[9] Do investors in the US (the world's largest equity market) suffer more from 'illusions' than investors in for example Austria and Finland? Why did the relationship not exist in the US before 1980 (or 1965) and why did the equilibrium break down during the 2008 crisis? And if government bonds and stocks are competing assets, what is the role of corporate bonds?
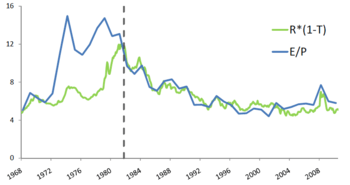
The recently proposed capital structure substitution theory argues that the Fed model indeed needs to be re-specified. It suggests that supply (company management), rather than demand (investors) drives the relationship between E/P and interest rates. Stock market earnings yield tends to equilibrium not with the government bond yield but with the average after-tax corporate bond yield as companies adjust capital structure (mix of equity and bonds) to maximize earnings per share.[13] If managements consistently optimize capital structure by substituting stocks (repurchasing shares) for bonds or vice versa, equilibrium is reached when:
where E is the earnings-per-share of company x, P is the share price, R is the nominal interest rate on corporate bonds and T is the corporate tax rate. For a long time the after-tax interest rate on corporate bonds was roughly equal to the 10-year Treasury rate. But during the 2008 financial crisis this relationship broke down, as Baa rated corporate bonds peaked at over 9%, and 10-year treasuries bottomed under 2.5% (see figure 3). In the US, SEC Rule 10b-18 (explicitly allowing share repurchases) enabled fine adjustment toward equilibrium as of 1982, explaining why the equilibrium emerged around that time and not before. And in many other countries share repurchases were prohibited until 1998 or are still considered illegal, explaining why the Fed model equilibrium was observed in the US but not in many other international markets.


References
- ↑ Yardeni, Ed (1997). "Fed's stock market model finds overvaluation". US Equity Research, Deutsche Morgan Grenfell.
- ↑ Yardeni, Ed (1999). "New, improved stock valuation model". US Equity Research, Deutsche Morgan Grenfell.
- ↑ Greenspan, Alan (2007). The Age of Turbulence: Adventures in a New World. New York: Penguin Press. p. 14. ISBN 1-59420-131-5.
- 1 2 Salomons, R. (2006). "A Tactical Implication of Predictability: Fighting the FED model". The Journal of Investing.
- ↑
- 1 2 3 Asness, Clifford (2003). "Fight the FED model". Journal of Portfolio Management.
- ↑ Thomas, J.; Zhang, F (2007). "Don't fight the Fed Model" (PDF).
- ↑ Bekaert, Geert; Engstrom, Eric (April 2008). "Inflation and the Stock Market: Understanding the 'Fed Model'". SSRN 1125355
 .
. - 1 2 3 Estrada, J. (2006). "The Fed model: A note". Finance Research Letters: 14–22.
- ↑ Feinman, J. (2003). "Inflation illusion and the (mis)pricing of assets and liabilities" (PDF). Journal of Investing: 29–36.
- ↑ Ritter, J.R.; Warr, R.S. (2002). "The decline of inflation and the bull market of 1982–1999" (PDF). Journal of Financial and Quantitative Analysis: 29.
- ↑ Lauricella, Tom (19 January 2008). "When Is It Time to Buy Stocks Again?". Wall Street Journal.
- ↑ Timmer, Jan (2011). "Understanding the Fed Model, Capital Structure, and then Some".
Further reading
- Lander, Joel; Orphanides, Athanasios; Douvogiannis, Martha (1997). "Earnings, Forecasts and the Predictability of Stock Returns: Evidence From Trading the S&P". Journal of Portfolio Management. 23 (4): 24–35. doi:10.3905/jpm.1997.409620. [The research paper by three Federal Reserve economists that gave rise to the somewhat misleading name 'Fed Model' to describe the idea of comparing earnings yields to treasury yields].
External links
- The "FED Model" theory of equity valuation- A blog discussion of the "Fed model" and how to apply it to the S&P 500 index.
- Investopedia: The Fed Model and Stock Valuation
- Investopedia: Breaking down the Fed model
- Seeking Alpha: Debunking the Fed model