Full results of the South Australian state election, 2014
Full results of the South Australian state election, 2014:
Lower house
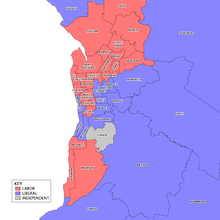
Metropolitan seats
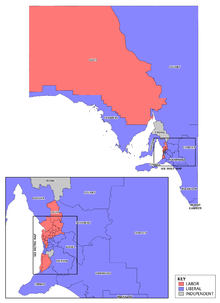
Rural seats
| Party & seats contested | Votes | % | Swing | Seats | Change | |
|---|---|---|---|---|---|---|
| Liberal Party of Australia − 47 | 455,797 | 44.8 | +3.1 | 22 | +4 | |
| Australian Labor Party − 47 | 364,420 | 35.8 | −1.7 | 23 | –3 | |
| SA Greens − 47 | 88,600 | 8.7 | +0.6 | 0 | 0 | |
| Family First Party − 42 | 63,575 | 6.2 | +0.9 | 0 | 0 | |
| Dignity for Disability − 7 | 5,934 | 0.6 | +0.4 | 0 | 0 | |
| Nationals SA − 2 | 1,328 | 0.1 | –0.9 | 0 | 0 | |
| Free Australia Party − 1 | 247 | 0.0 | –0.2 | 0 | 0 | |
| Independent − 10 | 37,955 | 3.7 | −1.0 | 2 | −1 | |
| Total | 1,017,856 | 47 | ||||
| Australian Labor Party | WIN | 47.0 | −1.4 | 23 | −3 | |
| Liberal Party of Australia | 53.0 | +1.4 | 22 | +4 | ||
Independents: Bob Such, Geoff Brock
Upper house
|
| |||||||||||||||||||||||||||||||||||||||||||||||||||||||||||||||||||||||||||||||||||||||||||||||||||||||||||||||||||||||||||||||||||||||||||||||||||||||||||||||||||||||||||||||||||||||||||||||||||||||||||||||||||||||||||||||||||||||||||||||||||||||||||||||||||
See also
- Candidates of the South Australian state election, 2014
- Full results of the South Australian state election, 2010
References
- ↑ "House of Assembly". 2014 South Australian Election. ABC.net.au.
- ↑ "House of Assembly". 2014 South Australian Election. ECSA.sa.gov.au.
- ↑ "2014 SA pendulum". 2014 South Australian Election. ABC.net.au.
- ↑ "Legislative Council". 2014 South Australian Election. ABC.net.au.
- ↑ "Legislative Council". 2014 South Australian Election. ECSA.sa.gov.au.
- ↑ Legislative Council Statement of Results Report, 2014 SA election: ECSA
This article is issued from Wikipedia - version of the 11/21/2016. The text is available under the Creative Commons Attribution/Share Alike but additional terms may apply for the media files.