Hastings Borough Council elections
Half of Hastings Borough Council in East Sussex, England is elected every two years, while before 2002 the council was elected by thirds. Since the last boundary changes in 2002, 32 councillors have been elected from 16 wards.[1]
Political control
Since the first election to the council in 1973 political control of the council has been held by the following parties:[2]
| Party in control | Years |
|---|---|
| No overall control | 1973 - 1976 |
| Conservative | 1976 - 1980 |
| No overall control | 1980 - 1996 |
| Liberal Democrats | 1996 - 1998 |
| Labour | 1998 - 2004 |
| No overall control | 2004 - 2006 |
| Conservative | 2006 - 2007 |
| No overall control | 2007 - 2010 |
| Labour | 2010 - Present |
Council elections
- Hastings Borough Council election, 1973
- Hastings Borough Council election, 1976
- Hastings Borough Council election, 1979 (New ward boundaries)[3]
- Hastings Borough Council election, 1980
- Hastings Borough Council election, 1982
- Hastings Borough Council election, 1983
- Hastings Borough Council election, 1984
- Hastings Borough Council election, 1986
- Hastings Borough Council election, 1987
- Hastings Borough Council election, 1988
- Hastings Borough Council election, 1990
- Hastings Borough Council election, 1991
- Hastings Borough Council election, 1992
- Hastings Borough Council election, 1994
- Hastings Borough Council election, 1995
- Hastings Borough Council election, 1996
| Election | Con | Lab | Lib | Control | Turnout | Notes |
|---|---|---|---|---|---|---|
| Hastings Borough Council election, 1998 | 1 | 18 | 13 | Labour | ||
| Hastings Borough Council election, 1999 | 2 | 18 | 12 | Labour | ||
| Hastings Borough Council election, 2000 | 6 | 18 | 8 | Labour | ||
| Hastings Borough Council election, 2002 | 10 | 21 | 1 | Labour | 32.0% | New ward boundaries[4] |
| Hastings Borough Council election, 2004 | 13 | 15 | 4 | NOC | 34.5% | |
| Hastings Borough Council election, 2006 | 17 | 10 | 5 | Conservative | 37.6% | |
| Hastings Borough Council election, 2008 | 15 | 13 | 3 | NOC | ||
| Hastings Borough Council election, 2010 | 14 | 16 | 1 | Labour | ||
| Hastings Borough Council election, 2012 | 9 | 23 | 0 | Labour | ||
| Hastings Borough Council election, 2014 | 8 | 24 | 0 | Labour |
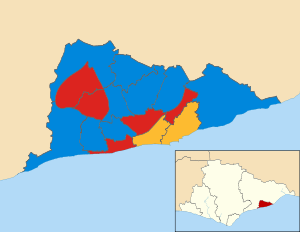
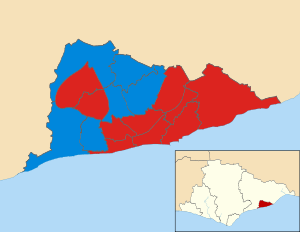
Borough result maps
-

2002 results map
-

2004 results map
-

2006 results map
-

2008 results map
-

2010 results map
By-election results
1997-2001
| Party | Candidate | Votes | % | ± | |
|---|---|---|---|---|---|
| Liberal Democrat | 464 | 47.5 | +5.4 | ||
| Labour | 326 | 33.4 | +0.0 | ||
| Conservative | 104 | 10.6 | -9.8 | ||
| Liberal | 82 | 8.4 | +8.4 | ||
| Majority | 138 | 14.1 | |||
| Turnout | 976 | 27.0 | |||
| Liberal Democrat hold | Swing | ||||
| Party | Candidate | Votes | % | ± | |
|---|---|---|---|---|---|
| Liberal Democrat | 479 | 40.3 | -11.9 | ||
| Conservative | 438 | 36.8 | +12.5 | ||
| Labour | 272 | 22.9 | -0.7 | ||
| Majority | 41 | 3.5 | |||
| Turnout | 1,189 | 25 | |||
| Liberal Democrat hold | Swing | ||||
2001-2005
| Party | Candidate | Votes | % | ± | |
|---|---|---|---|---|---|
| Labour | 918 | 44.6 | +1.1 | ||
| Conservative | 670 | 32.6 | +17.2 | ||
| Liberal Democrat | 469 | 22.8 | -18.3 | ||
| Majority | 248 | 12.0 | |||
| Turnout | 2,057 | ||||
| Labour hold | Swing | ||||
| Party | Candidate | Votes | % | ± | |
|---|---|---|---|---|---|
| Conservative | Gladys Martin | 504 | 37.6 | -4.4 | |
| Liberal Democrat | Colin Dormer | 294 | 21.9 | -0.7 | |
| Labour | John Ward | 274 | 20.4 | -2.4 | |
| Independent | Robert Harris | 253 | 18.9 | +6.4 | |
| Green | Kevin Young | 17 | 1.3 | +1.3 | |
| Majority | 210 | 15.7 | |||
| Turnout | 1,342 | 34.5 | |||
| Conservative hold | Swing | ||||
2005-2009
| Party | Candidate | Votes | % | ± | |
|---|---|---|---|---|---|
| Labour | Andrew Cartwright | 516 | 34.2 | +8.0 | |
| Conservative | Simon Corello | 475 | 31.5 | -15.7 | |
| Liberal Democrat | Tricia Kennelly | 332 | 22.0 | +2.2 | |
| Green | Sally Phillips | 92 | 6.1 | -0.7 | |
| BNP | John Martin | 55 | 3.6 | +3.6 | |
| UKIP | Mick Turner | 38 | 2.5 | +2.5 | |
| Majority | 41 | 2.7 | |||
| Turnout | 1,508 | 37.8 | |||
| Labour gain from Conservative | Swing | ||||
| Party | Candidate | Votes | % | ± | |
|---|---|---|---|---|---|
| Labour | Bruce Dowling | 555 | 39.2 | +4.5 | |
| Conservative | Matthew Lock | 482 | 34.1 | -9.1 | |
| Liberal Democrat | Mike Howard | 254 | 18.0 | -4.1 | |
| BNP | Nicholas Prince | 84 | 5.9 | +5.9 | |
| UKIP | Diane Granger | 40 | 2.8 | +2.8 | |
| Majority | 73 | 5.1 | |||
| Turnout | 1,415 | 41.9 | |||
| Labour gain from Conservative | Swing | ||||
2009-2013
| Party | Candidate | Votes | % | ± | |
|---|---|---|---|---|---|
| Conservative | Simon Corello | 609 | 40.7 | -17.9 | |
| Labour | Michael Ward | 550 | 36.7 | -12.5 | |
| Liberal Democrat | John Tunbridge | 210 | 14.0 | -3.2 | |
| BNP | Stephen Weir | 93 | 6.2 | +6.2 | |
| English Democrat | Rod Bridger | 36 | 2.4 | +2.4 | |
| Majority | 59 | 4.0 | |||
| Turnout | 1,498 | 37.4 | |||
| Conservative hold | Swing | ||||
References
- ↑ "Council Structure". Hastings Borough Council. Retrieved 2009-12-11.
- ↑ "Hastings". BBC News Online. 19 April 2008. Retrieved 2009-12-11.
- ↑ legislation.gov.uk - The Borough of Hastings (Electoral Arrangements) Order 1978. Retrieved on 19 November 2015.
- ↑ legislation.gov.uk - The Borough of Hastings (Electoral Changes) Order 2001. Retrieved on 4 October 2015.
- 1 2 "Tories lose battle of Hastings". The Argus. 2007-05-04. Retrieved 2009-12-11.
- ↑ "Tories hold St Helens". Sussex Express. 2009-12-11. Retrieved 2009-12-11.
External links
This article is issued from Wikipedia - version of the 4/20/2016. The text is available under the Creative Commons Attribution/Share Alike but additional terms may apply for the media files.