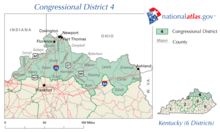
Kentucky's 4th congressional district
| Kentucky's 4th congressional district | ||
|---|---|---|
.tif.png) | ||
| Current Representative | Thomas Massie (R–Garrison) | |
| Distribution | 59.79% urban, 40.21% rural | |
| Population (2000) | 673,588 | |
| Median income | $40,150 | |
| Ethnicity | 95.8% White, 2.3% Black, 0.5% Asian, 1.1% Hispanic, 0.2% Native American, 0.0% other | |
| Cook PVI | R+15[1] | |
Kentucky's 4th congressional district is a congressional district in the U.S. state of Kentucky. Located in the northeastern portion of the state, it is a long district that follows the Ohio River. The majority of voters live in the booming suburban Cincinnati counties of Boone, Kenton and Campbell, which includes such suburbs as Fort Mitchell, Covington, Florence, Newport, and Fort Thomas. It also stretches into the outer suburbs of Louisville (including a small portion of Louisville itself) and Lexington.
The district is currently represented by Republican Thomas Massie, who was elected in a special election in 2012 to succeed Republican Geoff Davis, who resigned on July 31, 2012 citing family concerns.
Characteristics
The 4th was one of the first areas of Kentucky to turn Republican; it has been in GOP hands for all but six years since 1967. Its politics are dominated by Republicans in the wealthy Cincinnati suburbs, which have swelled with former Cincinnati residents since the early 1960s. Indeed, when Massie took office, he became the first congressman from the district's eastern portion in 45 years. Nonetheless, Democrats still hold state and local offices in rural counties.
As of November 7, 2006, there were a total of 476,480 registered voters. Of these, 250,986 (52.67%) identified as Democrats, 184,705 (38.76%) identified as Republicans, and 40,789 (8.56%) identified as "Others."
As of September 2013, there were 529,548 registered voters: 245,211 (46.30%) Democrats, 229,731 (43.38%) Republicans, and 54,606 (10.31%) "Others". All of the "Others" included 38,561 (7.28%) unclassified Others, 14,931 (2.82%) Independents, 841 (0.16%) Libertarians, 185 (0.03%) Greens, 51 (0.01%) Constitutionalists, 24 (0.0045%) Reforms, and 13 (0.0025%) Socialist Workers.[2][3]
Until January 1, 2006, Kentucky did not track party affiliation for registered voters who were neither Democratic nor Republican.[4] The Kentucky voter registration card does not explicitly list anything other than Democratic Party, Republican Party, or Other, with the "Other" option having a blank line and no instructions on how to register as something else.[5]
List of representatives
| Representative | Party | Years | District Residence | Note |
|---|---|---|---|---|
| District created |
March 4, 1803 | |||
 Thomas Sandford Thomas Sandford | March 4, 1803 – March 3, 1807 | |||
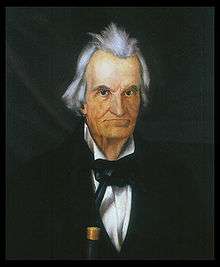
 Richard M. Johnson Richard M. Johnson | March 4, 1807 – March 3, 1813 | Redistricted to the 3rd district
Vice President 1837-1841 | ||
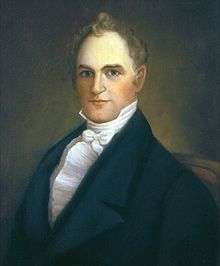 Joseph Desha Joseph Desha | March 4, 1813 – March 3, 1819 | Redistricted from the 6th district | ||
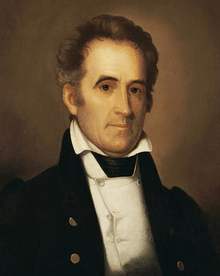
 Thomas Metcalfe Thomas Metcalfe | March 4, 1819 – March 3, 1823 | Redistricted to the 2nd district | ||
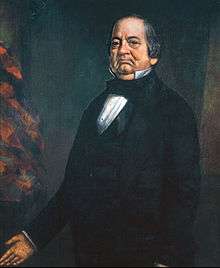 Robert P. Letcher Robert P. Letcher | March 3, 1823 – March 3, 1825 | |||
| March 4, 1825 – March 3, 1829 | ||||
| March 4, 1829 – March 3, 1833 | ||||
| Martin Beaty | March 4, 1833 – March 3, 1835 | |||
| Sherrod Williams | March 4, 1835 – March 3, 1837 | |||
| March 4, 1837 – March 3, 1841 | ||||
| Bryan Owsley | March 4, 1841 – March 3, 1843 | |||
| George Caldwell | March 4, 1843 – March 3, 1845 | |||
 Joshua F. Bell Joshua F. Bell | March 4, 1845 – March 3, 1847 | |||
| Aylette Buckner | March 4, 1847 – March 3, 1849 | |||
| George Caldwell | March 4, 1849 – March 3, 1851 | |||
 William T. Ward William T. Ward | March 4, 1851 – March 3, 1853 | |||
| James Chrisman | March 4, 1853 – March 3, 1855 | |||
 Albert G. Talbott Albert G. Talbott | March 4, 1855 – March 3, 1859 | |||
| William C. Anderson | March 4, 1859 – March 3, 1861 | |||
 Aaron Harding Aaron Harding | March 4, 1861 – March 3, 1865 | |||
| March 4, 1865 – March 3, 1867 | ||||
 J. Proctor Knott J. Proctor Knott | March 4, 1867 – March 3, 1871 | |||
 William B. Read William B. Read | March 4, 1871 – March 3, 1875 | |||
| J. Proctor Knott | March 4, 1875 – March 3, 1883 | |||
| Thomas A. Robertson | March 4, 1883 – March 3, 1887 | |||
 Alexander B. Montgomery Alexander B. Montgomery | March 4, 1887 – March 3, 1895 | |||
.jpg) John W. Lewis John W. Lewis | March 4, 1895 – March 3, 1897 | |||
 David H. Smith David H. Smith | March 4, 1897 – March 3, 1907 | |||
 Ben Johnson Ben Johnson | March 4, 1907 – March 3, 1927 | |||
 Henry D. Moorman Henry D. Moorman | March 4, 1927 – March 3, 1929 | |||
| John D. Craddock | March 4, 1929 – March 3, 1931 | |||
| Cap R. Carden | March 4, 1931 – March 3, 1933 | Redistricted to the at-large district | ||
| District redistricted to at-large district | March 4, 1933 | |||
| District re-established from at-large district | January 3, 1935 | |||
| Cap R. Carden | March 4, 1935 – June 13, 1935 | Redistricted from the at-large district, Died | ||
| Edward W. Creal | November 5, 1935 – October 13, 1943 | Died | ||
| Chester Carrier | November 30, 1943 – January 3, 1945 | |||
 Frank Chelf Frank Chelf | January 3, 1945 – January 3, 1967 | |||
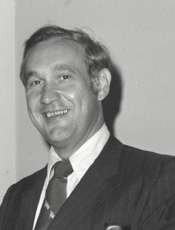 Gene Snyder Gene Snyder | January 3, 1967 – January 3, 1987 | |||
 Jim Bunning Jim Bunning | January 3, 1987 – January 3, 1999 | |||
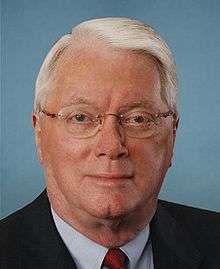
 Ken Lucas Ken Lucas | January 3, 1999 – January 3, 2005 | |||
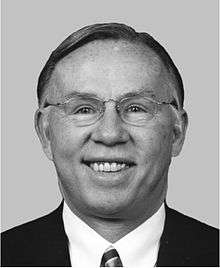
 Geoff Davis Geoff Davis | January 3, 2005 – July 31, 2012 | Resigned | ||
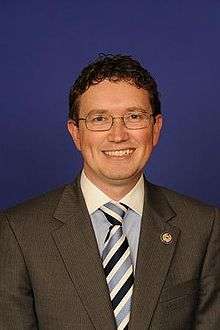 Thomas Massie Thomas Massie | November 6, 2012 – Present | Garrison | ||
Recent election results
2002
| Party | Candidate | Votes | % | |
|---|---|---|---|---|
| Democratic | Ken Lucas* | 87,776 | 51.11 | |
| Republican | Geoff Davis | 81,651 | 47.55 | |
| Libertarian | John Grote | 2,308 | 1.34 | |
| Total votes | 171,735 | 100.00 | ||
| Voter turnout | % | |||
| Democratic hold | ||||
2004
| Party | Candidate | Votes | % | |||
|---|---|---|---|---|---|---|
| Republican | Geoff Davis | 160,982 | 54.40 | |||
| Democratic | Nick Clooney | 129,876 | 43.89 | |||
| Independent | Michael Slider | 5,069 | 1.71 | |||
| Total votes | 295,927 | 100.00 | ||||
| Voter turnout | % | |||||
| Republican gain from Democratic | ||||||
2006
| Party | Candidate | Votes | % | |
|---|---|---|---|---|
| Republican | Geoff Davis* | 105,845 | 51.69 | |
| Democratic | Ken Lucas | 88,822 | 43.38 | |
| Libertarian | Brian Houillion | 10,100 | 4.93 | |
| Total votes | 204,765 | 100.00 | ||
| Voter turnout | % | |||
| Republican hold | ||||
2008
| Party | Candidate | Votes | % | |
|---|---|---|---|---|
| Republican | Geoff Davis* | 190,210 | 63.03 | |
| Democratic | Michael Kelley | 111,549 | 36.97 | |
| Total votes | 301,759 | 100.00 | ||
| Voter turnout | % | |||
| Republican hold | ||||
2010
| Party | Candidate | Votes | % | |
|---|---|---|---|---|
| Republican | Geoff Davis* | 151,774 | 69.48 | |
| Democratic | John Waltz | 66,675 | 30.52 | |
| Total votes | 218,449 | 100.00 | ||
| Voter turnout | % | |||
| Republican hold | ||||
2012
| Party | Candidate | Votes | % | |
|---|---|---|---|---|
| Republican | Thomas Massie | 186,026 | 62.13 | |
| Democratic | William Adkins | 104,731 | 34.98 | |
| Independent | David Lewis | 8,673 | 2.90 | |
| Total votes | 299,430 | 100.00 | ||
| Voter turnout | % | |||
| Republican hold | ||||
Historical district boundaries
See also
References
- ↑ "Partisan Voting Index Districts of the 113th Congress: 2004 & 2008" (PDF). The Cook Political Report. 2012. Retrieved 2013-01-10.
- ↑ "Registration Statistics: By Congression District". Kentucky State Board of Elections. September 2013. Retrieved 2014-02-06.
- ↑ "Registration Statistics: Other Political Organizations and Groups". Kentucky State Board of Elections. September 2013. Retrieved 2014-02-06.
- ↑ "Kentucky Administrative Regulations 31KAR4:150". Kentucky Legislative Research Commission. November 2005. Retrieved 2014-02-06.
- ↑ "Register To Vote". Kentucky State Board of Elections. August 2003. Retrieved 2014-02-06.
- Martis, Kenneth C. (1989). The Historical Atlas of Political Parties in the United States Congress. New York: Macmillan Publishing Company.
- Martis, Kenneth C. (1982). The Historical Atlas of United States Congressional Districts. New York: Macmillan Publishing Company.
- Congressional Biographical Directory of the United States 1774–present
Coordinates: 38°33′57″N 84°25′40″W / 38.56583°N 84.42778°W