National Assembly of South Africa
| National Assembly List
| |
|---|---|
| 26th Parliament | |
| Type | |
| Type | |
| Leadership | |
Deputy Speaker | |
Leader of Government Business | |
| Structure | |
| Seats | 400 |
 | |
Political groups | |
| Elections | |
| Party-list proportional representation | |
Last election | 7 May 2014 |
Next election | 2019 |
| Meeting place | |
 | |
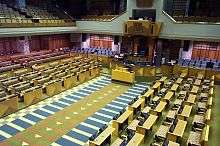
| National Assembly Chamber, Houses of Parliament, Cape Town, Western Cape, South Africa | |
| Website | |
| National Assembly | |
The National Assembly is the lower house of the Parliament of South Africa, located in Cape Town, Western Cape Province. It consists of four hundred members who are elected every five years using a party-list proportional representation system where half of the members are elected proportionally from 9 provincial lists and the remaining half from national lists so as to restore proportionality.
The National Assembly is presided over by a Speaker, assisted by a Deputy Speaker. The current Speaker is Baleka Mbete and the Deputy Speaker is Lechesa Tsenoli; they were elected on 21 May 2014.[1]
Allocation
The National Assembly seats are allocated using a proportional representation system with closed lists. Seats are first allocated according to the (integer part of the) Droop quota. Thereafter at most five seats are allocated using the largest remainder method (using the Droop quota). Any additional seats are allocated amongst the parties who then already have seats using the highest averages method.
Voters have one vote at elections to the National Assembly. Seats are allocated in ten multi-member constituencies via party lists. One constituency is a national or 'at large' constituency and nine others represent each of the nine provinces. The lists were called the national lists and regional lists in the 2009 election. 'Regional' was used to avoid confusion with the provincial legislature elections held at the same time. Previously they were called 'National to National' and 'Provincial to National'.
Of the 400 members of the National Assembly, half are assigned to be elected from national lists and the remaining half are assigned to be elected from regional lists. Every election, the Independent Electoral Commission (IEC) determines the allocation of the 200 regional list seats to each province by population.
Parties decide whether they want to set up both national and regional lists or only regional lists. In the 2009 election, the Democratic Alliance (DA) chose not to use a national list. The nationwide votes entitled the DA to 67 seats, but the provincial votes amounted to only 35 seats. While normally the remaining 32 members would be drawn from the party's national list, in this case the remaining seats were distributed among the other DA regional list candidates. This resulted in the National Assembly being made up of 168 members elected on national lists and 232 members elected on regional lists.
History
_party_composition_history.svg.png)
 |
| This article is part of a series on the politics and government of South Africa |
|
Related topics |
The National Assembly was first elected in South Africa's first non-racial election in 1994 with the African National Congress (ANC) winning 252 of the 400 seats. The National Party (NP), the previous governing party, won 82 seats, and the Inkatha Freedom Party (IFP) won 43. Under the terms of the Interim Constitution this result entitled the NP and the IFP to take part in the Government of National Unity alongside the ANC, and gave the ANC and NP the right to each nominated one Deputy President. The other parties represented in the assembly were the Freedom Front (9 seats), the Democratic Party (7 seats), the Pan Africanist Congress (5 seats), and the African Christian Democratic Party (2 seats).
In the election of 1999, the ANC won 266 seats, one short of the two-thirds majority needed to unilaterally amend the constitution. The DP expanded its representation to become the official opposition with 38 seats, while the IFP won 34. The NP, now renamed the New National Party (NNP), dropped to 28 seats, and the newly formed United Democratic Movement (UDM) won 14. Eight smaller parties also obtained seats in the assembly.
In the election of 2004 the ANC obtained 279 seats, gaining a two-thirds majority and the ability to change the constitution. The DP became the Democratic Alliance (DA) and remained the official opposition with 50 seats, while the IFP won 28 seats. The NNP was severely weakened, obtaining only 7 seats; the party was formally disbanded in 2005 with the majority of the party joining the ANC.
In the election of 2009 the ANC lost its two-thirds majority but remained the majority party with 264 seats. The DA increased its support to 67 seats, and the new Congress of the People (COPE) party, a breakaway from the ANC, obtained 30 seats. The IFP was reduced to 18 seats.
The following table shows the party composition of the National Assembly over time.
| Event | Date | ANC | DP / DA | NP / NNP | COPE | EFF | IFP | NFP | VF / VF+ | UDM | ACDP | ID | Others |
|---|---|---|---|---|---|---|---|---|---|---|---|---|---|
| 1994 election | 27 April 1994 | 252 | 7 | 82 | — | — | 43 | — | 9 | — | 2 | — | 5 |
| 1999 election | 2 June 1999 | 266 | 38 | 28 | — | — | 34 | — | 3 | 14 | 6 | — | 11 |
| 2003 floor-crossing | 4 April 2003 | 275 | 46 | 20 | — | — | 31 | — | 3 | 4 | 7 | 1 | 13 |
| 2004 election | 14 April 2004 | 279 | 50 | 7 | — | — | 28 | — | 4 | 9 | 7 | 7 | 9 |
| 2005 floor-crossing | 15 September 2005 | 293 | 47 | — | — | — | 23 | — | 4 | 6 | 4 | 5 | 18 |
| 2007 floor-crossing | 15 September 2007 | 297 | 47 | — | — | — | 23 | — | 4 | 6 | 4 | 4 | 15 |
| 2009 election | 22 April 2009 | 264 | 67 | — | 30 | — | 18 | — | 4 | 4 | 3 | 4 | 6 |
| 2014 election | 7 May 2014 | 249 | 89 | — | 3 | 25 | 10 | 6 | 4 | 4 | 3 | — | 7 |
Election results
The last election was held on 7 May 2014.
| Party | Votes | % | +/− | Seats | +/− | ||
|---|---|---|---|---|---|---|---|
| list | African National Congress | 11,436,921 | 62.15 | 249 | |||
| list | Democratic Alliance | 4,091,584 | 22.23 | [lower-alpha 1] |
89 | [lower-alpha 1] | |
| list | Economic Freedom Fighters | 1,169,259 | 6.35 | New | 25 | New | |
| list | Inkatha Freedom Party | 441,854 | 2.40 | 10 | |||
| list | National Freedom Party | 288,742 | 1.57 | New | 6 | New | |
| list | United Democratic Movement | 184,636 | 1.00 | 4 | |||
| list | Freedom Front Plus | 165,715 | 0.90 | 4 | |||
| list | Congress of the People | 123,235 | 0.67 | 3 | |||
| list | African Christian Democratic Party | 104,039 | 0.57 | 3 | |||
| list | African Independent Congress | 97,642 | 0.53 | New | 3 | New | |
| list | Agang SA | 52,350 | 0.28 | New | 2 | New | |
| list | Pan Africanist Congress | 37,784 | 0.21 | 1 | |||
| list | African People's Convention | 30,676 | 0.17 | 1 | |||
| list | Al Jama-ah | 25,976 | 0.14 | 0 | |||
| list | Minority Front | 22,589 | 0.12 | 0 | |||
| list | United Christian Democratic Party | 21,744 | 0.12 | 0 | |||
| list | Azanian People's Organisation | 20,421 | 0.11 | 0 | |||
| list | Bushbuckridge Residents Association | 15,271 | 0.08 | New | 0 | New | |
| list | Independent Civic Organisation | 14,472 | 0.08 | New | 0 | New | |
| list | Patriotic Alliance | 13,263 | 0.07 | New | 0 | New | |
| list | Workers and Socialist Party | 8,331 | 0.05 | New | 0 | New | |
| list | Ubuntu Party | 8,234 | 0.04 | New | 0 | New | |
| list | Kingdom Governance Movement | 6,408 | 0.03 | New | 0 | New | |
| list | Front National | 5,138 | 0.03 | New | 0 | New | |
| list | Keep It Straight and Simple | 4,294 | 0.02 | 0 | |||
| list | Pan Africanist Movement | 3,815 | 0.02 | 0 | |||
| list | First Nation Liberation Alliance | 3,297 | 0.02 | New | 0 | New | |
| list | United Congress | 3,136 | 0.02 | New | 0 | New | |
| list | National Party South Africa | 2,694 | 0.13 | 0 | |||
| list | Peoples Alliance | 1,671 | 0.01 | New | 0 | New | |
| Total | 18,402,497 | 100.00 | 400 | ||||
| Valid votes | 18,402,497 | 98.65 | |||||
| Spoilt votes | 251,960 | 1.35 | |||||
| Total votes cast | 18,654,457 | 100.00 | |||||
| Registered voters/turnout | 25,381,293 | 73.50 | |||||
| Source: IEC | |||||||
Notes:
- 1 2 Compared to the combined performance of the Democratic Alliance, the Independent Democrats and the South African Democratic Convention in 2009.
Current composition
| Party | Seats | % | |
|---|---|---|---|
| African National Congress | 249 | 62.25 | |
| Democratic Alliance | 89 | 22.25 | |
| Economic Freedom Fighters | 25 | 6.25 | |
| Inkatha Freedom Party | 10 | 2.5 | |
| National Freedom Party | 6 | 1.5 | |
| United Democratic Movement | 4 | 1 | |
| Freedom Front Plus | 4 | 1 | |
| Congress of the People | 3 | 0.75 | |
| African Christian Democratic Party | 3 | 0.75 | |
| African Independent Congress | 3 | 0.75 | |
| Agang SA | 2 | 0.5 | |
| Pan Africanist Congress | 1 | 0.25 | |
| African People's Convention | 1 | 0.25 | |
| Total | 400 | ||
References
- ↑ "Mbete becomes new speaker". Independent Online. 21 May 2014. Retrieved 22 May 2014.