North Dorset District Council elections
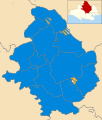
Map showing the composition of North Dorset District Council as of the last election in 2015. Conservatives in blue, Liberal Democrats in yellow and independents in grey.
North Dorset Council is elected every four years.
Political control
| Party in control | Years |
|---|---|
| Independent | 1973 - 1995 |
| Liberal Democrats | 1995 - 1999 |
| No overall control | 1999 - 2007 |
| Conservative | 2007 - present |
Council elections
- North Dorset District Council election, 1973
- North Dorset District Council election, 1976
- North Dorset District Council election, 1979
- North Dorset District Council election, 1983 (New ward boundaries)[1]
- North Dorset District Council election, 1987
- North Dorset District Council election, 1991 (District boundary changes took place but the number of seats remained the same)[2][3]
- North Dorset District Council election, 1995
- North Dorset District Council election, 1999
- North Dorset District Council election, 2003 (New ward boundaries)[4]
- North Dorset District Council election, 2007
- North Dorset District Council election, 2011
- North Dorset District Council election, 2015 (New ward boundaries)[5]
District result maps
-

2003 results map
-

2007 results map
-

2011 results map
-
2015 results map
By-election results
| Party | Candidate | Votes | % | ± | |
|---|---|---|---|---|---|
| Liberal Democrat | 413 | 45.6 | |||
| Conservative | 316 | 34.9 | |||
| Labour | 176 | 19.4 | |||
| Majority | 97 | 10.7 | |||
| Turnout | 905 | 23.7 | |||
| Liberal Democrat hold | Swing | ||||
| Party | Candidate | Votes | % | ± | |
|---|---|---|---|---|---|
| Liberal Democrat | 231 | 62.4 | +22.2 | ||
| Labour | 139 | 37.6 | +18.0 | ||
| Majority | 92 | 34.8 | |||
| Turnout | 370 | 28.0 | |||
| Liberal Democrat hold | Swing | ||||
| Party | Candidate | Votes | % | ± | |
|---|---|---|---|---|---|
| Liberal Democrat | 243 | 58.0 | +22.3 | ||
| Conservative | 119 | 28.4 | -5.3 | ||
| Independent | 57 | 13.6 | -17.1 | ||
| Majority | 124 | 29.6 | |||
| Turnout | 419 | 29.0 | |||
| Liberal Democrat hold | Swing | ||||
| Party | Candidate | Votes | % | ± | |
|---|---|---|---|---|---|
| Conservative | Stephen James | 434 | 46.8 | -4.7 | |
| Liberal Democrat | Ann Beckley | 374 | 40.3 | +19.3 | |
| Independent | Su Hunt | 119 | 12.8 | -14.7 | |
| Majority | 60 | 6.5 | |||
| Turnout | 927 | 34.3 | |||
| Conservative hold | Swing | ||||
| Party | Candidate | Votes | % | ± | |
|---|---|---|---|---|---|
| Liberal Democrat | 1,149 | 58.1 | +18.9 | ||
| Conservative | 775 | 39.2 | -12.6 | ||
| Labour | 52 | 2.6 | +2.6 | ||
| Majority | 374 | 18.9 | |||
| Turnout | 1,976 | 62.0 | |||
| Liberal Democrat gain from Conservative | Swing | ||||
| Party | Candidate | Votes | % | ± | |
|---|---|---|---|---|---|
| Liberal Democrat | 308 | 57.6 | +57.6 | ||
| Independent | 131 | 24.5 | +24.5 | ||
| Independent | 96 | 17.9 | +17.9 | ||
| Majority | 177 | 33.1 | |||
| Turnout | 535 | 35.5 | |||
| Liberal Democrat hold | Swing | ||||
| Party | Candidate | Votes | % | ± | |
|---|---|---|---|---|---|
| Liberal Democrat | David Fox | 429 | 57.0 | +47.4 | |
| Conservative | Ian Johns | 324 | 43.0 | +28.5 | |
| Majority | 105 | 14.0 | |||
| Turnout | 753 | 50.0 | |||
| Liberal Democrat gain from Independent | Swing | ||||
References
- ↑ The District of North Dorset (Electoral Arrangements) Order 1980
- ↑ legislation.gov.uk - The Dorset (District Boundaries) Order 1987. Retrieved on 6 November 2015.
- ↑ legislation.gov.uk - The Berkshire, Dorset and Wiltshire (County Boundaries) Order 1989. Retrieved on 5 November 2015.
- ↑ legislation.gov.uk - The District of North Dorset (Electoral Changes) Order 2002. Retrieved on 4 October 2015.
- ↑ legislation.gov.uk - The North Dorset (Electoral Changes) Order 2014. Retrieved on 3 November 2015.
External links
| Dorset County Council | |
|---|---|
| Bournemouth Borough Council | |
| Christchurch Borough Council | |
| East Dorset District Council | |
| North Dorset District Council |
|
| Poole Borough Council | |
| Purbeck District Council | |
| West Dorset District Council | |
| Weymouth and Portland Borough Council | |
| |
This article is issued from Wikipedia - version of the 5/8/2016. The text is available under the Creative Commons Attribution/Share Alike but additional terms may apply for the media files.