Lattice (music)


In musical tuning, a lattice "is a way of modeling the tuning relationships of a just intonation system. It is an array of points in a periodic multidimensional pattern. Each point on the lattice corresponds to a ratio (i.e., a pitch, or an interval with respect to some other point on the lattice). The lattice can be two-, three-, or n-dimensional, with each dimension corresponding to a different prime-number partial"[1] or chroma. (Note that "partial" in the above quote is a misnomer, because partials are sinusoidal components of complex tones, as defined by Helmholtz.)
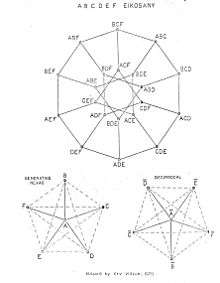
The points in a lattice represent pitch classes (or pitches if octaves are represented), and the connectors in a lattice represent the intervals between them. The connecting lines in a lattice display intervals as vectors, so that a line of the same length and angle always has the same intervalic relationship between the points it connects, no matter where it occurs in the lattice. Repeatedly adding the same vector (repeatedly stacking the same interval) moves you further in the same direction. Lattices in just intonation (limited to intervals comprising primes, their powers, and their products) are theoretically infinite (because no power of any prime equals any power of another prime). However, lattices are sometimes also used to notate limited subsets that are particularly interesting (such as an Eikosany illustrated further below or the various ways to extract particular scale shapes from a larger lattice).
Examples of musical lattices include the Tonnetz of Euler (1739) and Hugo Riemann and the tuning systems of Ben Johnston. Musical intervals in just intonation are related to those in equal tuning by Adriaan Fokker's Fokker periodicity blocks. Many multi-dimensional higher-limit tunings have been mapped by Erv Wilson. The limit is the highest prime number used in the ratios that define the intervals used by a tuning.
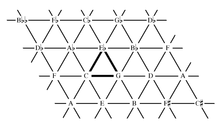
Thus Pythagorean tuning, which uses only the perfect fifth (3/2) and octave (2/1) and their multiples (powers of 2 and 3), is represented through a two-dimensional lattice, while standard (5-limit) just intonation, which adds the use of the just major third (5/4), may be represented through a three-dimensional lattice though "a twelve-note 'chromatic' scale may be represented as a two-dimensional (3,5) projection plane within the three-dimensional (2,3,5) space needed to map the scale. (Octave equivalents would appear on an axis at right angles to the other two, but this arrangement is not really necessary graphically.)".[1] In other words, the circle of fifths on one dimension and a series of major thirds on those fifths in the second (horizontal and vertical), with the option of imagining depth to model octaves:
 A----E----B----F#+
 |    |    |    |
 F----C----G----D
 |    |    |    |
 Db---Ab---Eb---Bb
equals the pitch classes (ignoring octaves and notating as ratios relative to an origin of 1/1):
5/3--5/4-15/8--45/32
 |    |    |     |
4/3--1/1--3/2---9/8
 |    |    |     |
16/15-8/5-6/5---9/5

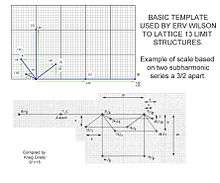
Erv Wilson has made significant headway with developing lattices than can represent higher limit harmonics, meaning more than 2 dimensions, while displaying them in 2 dimensions. Here is a template he used to generate what he called a “Euler“ lattice after where he drew his inspiration. Each prime harmonic (each vector representing a ratio of 1/n or n/1 where n is a prime) has a unique spacing, avoiding clashes even when generating lattices of multidimensional, harmonically based structure.
Another feature of the template is worth pointing out. Harmonically generated intervals (those with primes in the numerator) will always appear above the fundamental (1/1) and the subharmonics (those with primes in the denominator) below. With a 9-limit system the direction will be both above and to the right, leaving the other quadrant for more complex ratios with the opposite with the subharmonic. This makes it quite easy to understand what is being represented.
Erv Wilson would commonly use 10-squares-to-the-inch graph paper. That way, he had room to notate both ratios and often the scale degree, which explains why he didn't use a template where all the numbers where divided by 2. The scale degree always followed a period or dot to separate it from the ratios. Numerous examples appear throughout the Wilson Archives

See also
Sources
- 1 2 Gilmore, Bob (2006). "Introduction", p.xviii, "Maximum Clarity" and Other Writings on Music, edited by Bob Gilmore. Urbana: University of Illinois Press. ISBN 0-252-03098-2.
Further reading
- Johnston, Ben (2006). "Rational Structure in Music", "Maximum Clarity" and Other Writings on Music, edited by Bob Gilmore. Urbana: University of Illinois Press. ISBN 0-252-03098-2.