City of Bradford Metropolitan District Council election, 1980
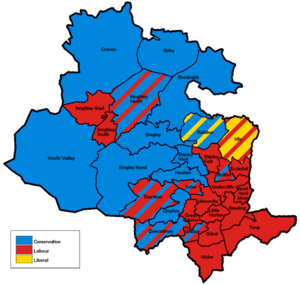
Map of the results for the 1980 Bradford council election.
Elections to City of Bradford Metropolitan District Council were held on were held on Thursday, 1 May 1980, with boundary changes prompting the entirety of the council to be elected.
The boundary changes subtracted a ward from the existing 31 - decreasing the councillor total by three to 90 - with just under half the ward names surviving the changes:
Abolished:
|
Created:
|
|
The election resulted in the Labour gaining control of the council directly from the Conservatives.[1][2]
Election result
| Bradford Local Election Result 1980[1] | ||||||||||
|---|---|---|---|---|---|---|---|---|---|---|
| Party | Seats | Gains | Losses | Net gain/loss | Seats % | Votes % | Votes | +/− | ||
| Labour | 50 | 0 | 0 | 0 | 55.5 | 46.1 | 66,916 | +0.0% | ||
| Conservative | 37 | 0 | 0 | 0 | 41.1 | 41.4 | 60,088 | -3.1% | ||
| Liberal | 3 | 0 | 0 | 0 | 3.3 | 10.8 | 15,736 | +1.5% | ||
| Ecology | 0 | 0 | 0 | 0 | 0.0 | 0.9 | 1,295 | +0.9% | ||
| Ratepayers & Residents Association | 0 | 0 | 0 | 0 | 0.0 | 0.4 | 516 | +0.4% | ||
| Independent | 0 | 0 | 0 | 0 | 0.0 | 0.3 | 431 | +0.2% | ||
This result had the following consequences for the total number of seats on the council after the elections:
| Party | Previous council | New council | |||
|---|---|---|---|---|---|
| Labour | 38 | 50 | |||
| Conservatives | 51 | 37 | |||
| Liberals | 4 | 3 | |||
| Total | 93 | 90 | |||
| Working majority | -9 | 10 | |||
Ward results
| Party | Candidate | Votes | % | ± | |
|---|---|---|---|---|---|
| Liberal | M. Atkinson | 3,389 | 46.8 | N/A | |
| Conservative | A. Lightowler | 2,629 | 36.3 | N/A | |
| Conservative | D. Moore | 2,394 | |||
| Liberal | K. Greenwood | 1,903 | |||
| Liberal | M. Greenwood | 1,732 | |||
| Labour | I. Alan | 1,222 | 16.9 | N/A | |
| Labour | K. Briggs | 1,214 | |||
| Labour | S. Lancaster | 1,088 | |||
| Majority | 763 | 10.5 | N/A | ||
| Turnout | 7,237 | N/A | |||
| Liberal win (new seat) | |||||
| Conservative win (new seat) | |||||
| Conservative win (new seat) | |||||
| Party | Candidate | Votes | % | ± | |
|---|---|---|---|---|---|
| Conservative | J. Booth | 2,166 | 43.3 | N/A | |
| Conservative | T. Shaw | 2,092 | |||
| Conservative | W. Nunn | 2,069 | |||
| Labour | M. Mould | 1,757 | 35.2 | N/A | |
| Liberal | M. Tregoning | 1,075 | 21.5 | N/A | |
| Liberal | J. Whitehead | 936 | |||
| Majority | 409 | 8.2 | N/A | ||
| Turnout | 4,998 | N/A | |||
| Conservative win (new seat) | |||||
| Conservative win (new seat) | |||||
| Conservative win (new seat) | |||||
| Party | Candidate | Votes | % | ± | |
|---|---|---|---|---|---|
| Conservative | E. Hall | 2,890 | 55.7 | N/A | |
| Conservative | D. Conquest | 2,713 | |||
| Conservative | J. Womersley | 2,611 | |||
| Labour | C. Wall | 1,340 | 25.8 | N/A | |
| Liberal | E. Roberts | 962 | 18.5 | N/A | |
| Liberal | S. Clemence | 925 | |||
| Majority | 1,550 | 29.8 | N/A | ||
| Turnout | 5,192 | N/A | |||
| Conservative win (new seat) | |||||
| Conservative win (new seat) | |||||
| Conservative win (new seat) | |||||
| Party | Candidate | Votes | % | ± | |
|---|---|---|---|---|---|
| Labour | J. Ryan | 2,131 | 50.2 | N/A | |
| Conservative | T. Hall | 2,112 | 49.8 | N/A | |
| Labour | J. Allinson | 2,112 | |||
| Labour | A. Scriven | 2,076 | |||
| Conservative | F. Lee | 2,048 | |||
| Conservative | E. Wooler | 2,001 | |||
| Majority | 19 | 0.4 | N/A | ||
| Turnout | 4,243 | N/A | |||
| Labour win (new seat) | |||||
| Conservative win (new seat) | |||||
| Labour win (new seat) | |||||
| Party | Candidate | Votes | % | ± | |
|---|---|---|---|---|---|
| Labour | L. Coughlin | 3,229 | 74.4 | N/A | |
| Labour | T. Wood | 3,202 | |||
| Labour | S. Gratton | 3,187 | |||
| Conservative | J. Claughton | 1,110 | 25.6 | N/A | |
| Conservative | P. Moore | 1,082 | |||
| Conservative | E. Swanson | 1,064 | |||
| Majority | 2,119 | 48.8 | N/A | ||
| Turnout | 4,339 | N/A | |||
| Labour win (new seat) | |||||
| Labour win (new seat) | |||||
| Labour win (new seat) | |||||
| Party | Candidate | Votes | % | ± | |
|---|---|---|---|---|---|
| Labour | P. Clarke | 3,289 | 68.9 | N/A | |
| Labour | J. Lambert | 3,230 | |||
| Labour | J. McKenna | 3,203 | |||
| Conservative | L. Kelly | 1,483 | 31.1 | N/A | |
| Conservative | G. Crossley | 1,442 | |||
| Conservative | M. Choudhury | 1,303 | |||
| Majority | 1,806 | 37.8 | N/A | ||
| Turnout | 4,772 | N/A | |||
| Labour win (new seat) | |||||
| Labour win (new seat) | |||||
| Labour win (new seat) | |||||
| Party | Candidate | Votes | % | ± | |
|---|---|---|---|---|---|
| Conservative | J. Hirst | 2,266 | 50.6 | N/A | |
| Conservative | R. Farley | 2,246 | |||
| Conservative | G. Seager | 2,224 | |||
| Labour | G. Mitchell | 2,216 | 49.4 | N/A | |
| Labour | E. Stead | 2,118 | |||
| Labour | R. Baxter | 2,083 | |||
| Majority | 50 | 1.1 | N/A | ||
| Turnout | 4,482 | N/A | |||
| Conservative win (new seat) | |||||
| Conservative win (new seat) | |||||
| Conservative win (new seat) | |||||
| Party | Candidate | Votes | % | ± | |
|---|---|---|---|---|---|
| Conservative | E. Hawkins | 2,218 | 40.7 | N/A | |
| Conservative | A. Jerome | 2,212 | |||
| Conservative | J. Barker | 2,204 | |||
| Liberal | R. Binns | 1,883 | 34.5 | N/A | |
| Liberal | E. Drew | 1,727 | |||
| Liberal | J. Wells | 1,637 | |||
| Labour | J. Lawrence | 1,353 | 24.8 | N/A | |
| Majority | 335 | 6.1 | N/A | ||
| Turnout | 5,454 | N/A | |||
| Conservative win (new seat) | |||||
| Conservative win (new seat) | |||||
| Conservative win (new seat) | |||||
| Party | Candidate | Votes | % | ± | |
|---|---|---|---|---|---|
| Labour | A. Dewhirst | 2,652 | 51.6 | N/A | |
| Labour | P. Lancaster | 2,583 | |||
| Labour | L. Crawforth | 2,528 | |||
| Conservative | S. Swallow | 1,974 | 38.4 | N/A | |
| Conservative | P. Heaton | 1,853 | |||
| Conservative | J. Lewis | 1,845 | |||
| Ratepayers & Residents Association | J. Foulds | 516 | 10.0 | N/A | |
| Majority | 678 | 13.2 | N/A | ||
| Turnout | 5,142 | N/A | |||
| Labour win (new seat) | |||||
| Labour win (new seat) | |||||
| Labour win (new seat) | |||||
| Party | Candidate | Votes | % | ± | |
|---|---|---|---|---|---|
| Labour | M. Thornton | 2,840 | 55.4 | N/A | |
| Labour | J. Godward | 2,780 | |||
| Labour | B. Kearns | 2,770 | |||
| Conservative | J. Rawnsley | 2,286 | 44.6 | N/A | |
| Conservative | H. Ormondroyd | 2,228 | |||
| Conservative | S. Briggs | 2,153 | |||
| Majority | 554 | 10.8 | N/A | ||
| Turnout | 5,126 | N/A | |||
| Labour win (new seat) | |||||
| Labour win (new seat) | |||||
| Labour win (new seat) | |||||
| Party | Candidate | Votes | % | ± | |
|---|---|---|---|---|---|
| Conservative | J. King | 2,884 | 61.1 | N/A | |
| Conservative | D. Emmott | 2,876 | |||
| Conservative | C. Hobson | 2,776 | |||
| Labour | H. Rashid | 1,838 | 38.9 | N/A | |
| Labour | D. McElroy | 1,742 | |||
| Labour | J. Bruce | 1,730 | |||
| Majority | 1,046 | 22.1 | N/A | ||
| Turnout | 4,722 | N/A | |||
| Conservative win (new seat) | |||||
| Conservative win (new seat) | |||||
| Conservative win (new seat) | |||||
| Party | Candidate | Votes | % | ± | |
|---|---|---|---|---|---|
| Liberal | P. Hockney | 2,015 | 38.0 | N/A | |
| Labour | K. Baxter | 1,830 | 34.5 | N/A | |
| Liberal | A. Bagshaw | 1,661 | |||
| Labour | A. Emsley | 1,649 | |||
| Labour | A. Miller | 1,610 | |||
| Liberal | L. Rennison | 1,506 | |||
| Conservative | T. Keighley | 1,457 | 27.5 | N/A | |
| Conservative | A. Garnett | 1,399 | |||
| Conservative | R. Hughes-Rowlands | 1,248 | |||
| Majority | 185 | 3.5 | N/A | ||
| Turnout | 5,302 | N/A | |||
| Liberal win (new seat) | |||||
| Labour win (new seat) | |||||
| Liberal win (new seat) | |||||
| Party | Candidate | Votes | % | ± | |
|---|---|---|---|---|---|
| Conservative | J. Spencer | 2,693 | 55.3 | N/A | |
| Conservative | J. Lightband | 2,626 | |||
| Conservative | A. Turner | 2,452 | |||
| Liberal | T. Crawshaw | 1,175 | 24.1 | N/A | |
| Liberal | S. Hobson | 1,091 | |||
| Labour | |||||
| Ecology | J. Fielding | 568 | 11.7 | N/A | |
| Independent | C. Poole | 431 | 8.9 | N/A | |
| Ecology | R. Adsell | 350 | |||
| Majority | 1,518 | 31.2 | N/A | ||
| Turnout | 4,867 | N/A | |||
| Conservative win (new seat) | |||||
| Conservative win (new seat) | |||||
| Conservative win (new seat) | |||||
| Party | Candidate | Votes | % | ± | |
|---|---|---|---|---|---|
| Conservative | P. Gilmour | 2,193 | 43.9 | N/A | |
| Conservative | A. Trigg | 2,089 | |||
| Labour | R. Hardacre | 2,028 | 40.6 | N/A | |
| Labour | F. Sunderland | 1,974 | |||
| Conservative | D. Smith | 1,877 | |||
| Labour | M. Allison | 1,833 | |||
| Liberal | G. Sims | 776 | 15.5 | N/A | |
| Liberal | P. Harrison | 618 | |||
| Majority | 165 | 3.3 | N/A | ||
| Turnout | 4,997 | N/A | |||
| Conservative win (new seat) | |||||
| Conservative win (new seat) | |||||
| Labour win (new seat) | |||||
| Party | Candidate | Votes | % | ± | |
|---|---|---|---|---|---|
| Labour | W. Clarkson | 2,440 | 58.9 | N/A | |
| Labour | E. Newby | 2,343 | |||
| Labour | H. Peacock | 2,314 | |||
| Liberal | J. Brooksbank | 867 | 20.9 | N/A | |
| Conservative | G. Dawson | 839 | 20.2 | N/A | |
| Conservative | J. Maxfield | 736 | |||
| Conservative | T. McDaid | 718 | |||
| Liberal | D. Beaumont | 631 | |||
| Liberal | S. Green | 581 | |||
| Majority | 1,573 | 37.9 | N/A | ||
| Turnout | 4,146 | N/A | |||
| Labour win (new seat) | |||||
| Labour win (new seat) | |||||
| Labour win (new seat) | |||||
| Party | Candidate | Votes | % | ± | |
|---|---|---|---|---|---|
| Labour | S. Bowen | 2,632 | 49.4 | N/A | |
| Labour | B. Thorne | 2,620 | |||
| Labour | P. Beeley | 2,483 | |||
| Conservative | M. Cowen | 2,205 | 41.4 | N/A | |
| Conservative | H. Harrison | 2,077 | |||
| Conservative | N. Smith | 1,975 | |||
| Liberal | R. Taylor | 491 | 9.2 | N/A | |
| Liberal | W. Edge | 452 | |||
| Majority | 427 | 8.0 | N/A | ||
| Turnout | 5,328 | N/A | |||
| Labour win (new seat) | |||||
| Labour win (new seat) | |||||
| Labour win (new seat) | |||||
| Party | Candidate | Votes | % | ± | |
|---|---|---|---|---|---|
| Labour | T. Brown | 2,923 | 75.1 | N/A | |
| Labour | A. Hameed | 2,685 | |||
| Labour | K. Ryalls | 2,672 | |||
| Conservative | V. Holdsworth | 968 | 24.9 | N/A | |
| Conservative | B. Robinson | 837 | |||
| Conservative | R. Robinson | 800 | |||
| Majority | 1,955 | 50.2 | N/A | ||
| Turnout | 3,891 | N/A | |||
| Labour win (new seat) | |||||
| Labour win (new seat) | |||||
| Labour win (new seat) | |||||
| Party | Candidate | Votes | % | ± | |
|---|---|---|---|---|---|
| Labour | D. Bentley | 2,734 | 57.0 | N/A | |
| Labour | J. Coope | 2,552 | |||
| Labour | K. Parker | 2,487 | |||
| Conservative | D. Mellor | 2,065 | 43.0 | N/A | |
| Conservative | T. Hill | 1,985 | |||
| Conservative | A. Rawnsley | 1,966 | |||
| Majority | 669 | 13.9 | N/A | ||
| Turnout | 4,799 | N/A | |||
| Labour win (new seat) | |||||
| Labour win (new seat) | |||||
| Labour win (new seat) | |||||
| Party | Candidate | Votes | % | ± | |
|---|---|---|---|---|---|
| Conservative | I. Cookland | 2,438 | 51.2 | N/A | |
| Conservative | J. Hirst | 2,363 | |||
| Labour | J. Smith | 2,323 | 48.8 | N/A | |
| Labour | H. Alpin | 2,320 | |||
| Conservative | J. Rees | 2,238 | |||
| Labour | L. Woodward | 2,201 | |||
| Majority | 115 | 2.4 | N/A | ||
| Turnout | 4,761 | N/A | |||
| Conservative win (new seat) | |||||
| Conservative win (new seat) | |||||
| Labour win (new seat) | |||||
| Party | Candidate | Votes | % | ± | |
|---|---|---|---|---|---|
| Conservative | W. Clavering | 2,942 | 56.9 | N/A | |
| Conservative | K. Emsley | 2,876 | |||
| Conservative | A. Raistrick | 2,702 | |||
| Liberal | C. Svensgaard | 931 | 18.0 | N/A | |
| Labour | L. Fox | 817 | 15.8 | N/A | |
| Labour | D. Warwick | 809 | |||
| Liberal | K. Powell | 774 | |||
| Labour | A. Pisacane | 735 | |||
| Liberal | V. Whelan | 732 | |||
| Ecology | P. Burnell | 476 | 9.2 | N/A | |
| Majority | 2,011 | 38.9 | N/A | ||
| Turnout | 5,166 | N/A | |||
| Conservative win (new seat) | |||||
| Conservative win (new seat) | |||||
| Conservative win (new seat) | |||||
| Party | Candidate | Votes | % | ± | |
|---|---|---|---|---|---|
| Labour | N. Free | 3,008 | 62.9 | N/A | |
| Labour | E. Saville | 2,916 | |||
| Labour | C. Hunter | 2,780 | |||
| Conservative | R. Wright | 1,121 | 23.5 | N/A | |
| Conservative | A. Shutt | 1,050 | |||
| Conservative | P. Barker | 996 | |||
| Liberal | D. Atkinson | 399 | 8.3 | N/A | |
| Liberal | R. Barker | 368 | |||
| Ecology | K. Taylor | 251 | 5.3 | N/A | |
| Ecology | C. Ormondroyd | 237 | |||
| Ecology | P. Dean | 195 | |||
| Majority | 1,887 | 39.5 | N/A | ||
| Turnout | 4,779 | N/A | |||
| Labour win (new seat) | |||||
| Labour win (new seat) | |||||
| Labour win (new seat) | |||||
| Party | Candidate | Votes | % | ± | |
|---|---|---|---|---|---|
| Conservative | O. Messer | 3,138 | 54.1 | N/A | |
| Conservative | J. Evans | 3,122 | |||
| Conservative | S. Arthur | 3,089 | |||
| Labour | M. Ryan | 1,984 | 34.2 | N/A | |
| Labour | J. Jones | 1,912 | |||
| Labour | K. Trobridge | 1,845 | |||
| Liberal | G. Roberts | 683 | 11.8 | N/A | |
| Liberal | R. Cole | 617 | |||
| Majority | 1,154 | 19.9 | N/A | ||
| Turnout | 5,805 | N/A | |||
| Conservative win (new seat) | |||||
| Conservative win (new seat) | |||||
| Conservative win (new seat) | |||||
| Party | Candidate | Votes | % | ± | |
|---|---|---|---|---|---|
| Labour | I. Wassell | 2,056 | 44.8 | N/A | |
| Conservative | E. Kinder | 2,048 | 44.6 | N/A | |
| Labour | A. Heaney | 2,035 | |||
| Conservative | D. Downey | 2,019 | |||
| Labour | B. Draxler | 1,969 | |||
| Conservative | R. Smith | 1,966 | |||
| Liberal | D. Garrad | 486 | 10.6 | N/A | |
| Liberal | N. Baggley | 479 | |||
| Liberal | L. Baggley | 453 | |||
| Majority | 8 | 0.2 | N/A | ||
| Turnout | 4,590 | N/A | |||
| Labour win (new seat) | |||||
| Conservative win (new seat) | |||||
| Labour win (new seat) | |||||
| Party | Candidate | Votes | % | ± | |
|---|---|---|---|---|---|
| Labour | G. Armitage | 2,379 | 50.0 | N/A | |
| Conservative | A. Pollard | 2,378 | 50.0 | N/A | |
| Labour | H. Baines | 2,314 | |||
| Conservative | D. Barker | 2,306 | |||
| Conservative | B. Curtis | 2,289 | |||
| Labour | A. Spiers | 2,272 | |||
| Majority | 1 | 0.0 | N/A | ||
| Turnout | 4,757 | N/A | |||
| Labour win (new seat) | |||||
| Conservative win (new seat) | |||||
| Labour win (new seat) | |||||
| Party | Candidate | Votes | % | ± | |
|---|---|---|---|---|---|
| Labour | J. Senior | 2,795 | 77.7 | N/A | |
| Labour | T. Mahon | 2,698 | |||
| Labour | D. Smith | 2,632 | |||
| Conservative | V. Owen | 800 | 22.3 | N/A | |
| Conservative | J. Butterfield | 764 | |||
| Majority | 1,995 | 55.5 | N/A | ||
| Turnout | 3,595 | N/A | |||
| Labour win (new seat) | |||||
| Labour win (new seat) | |||||
| Labour win (new seat) | |||||
| Party | Candidate | Votes | % | ± | |
|---|---|---|---|---|---|
| Labour | G. Goodyear | 2,637 | 60.4 | N/A | |
| Labour | E. Haslan | 2,559 | |||
| Labour | R. Sowman | 2,456 | |||
| Conservative | H. Ibbotson | 1,727 | 39.6 | N/A | |
| Conservative | D. Davison | 1,701 | |||
| Conservative | A. Craig | 1,600 | |||
| Majority | 910 | 20.8 | N/A | ||
| Turnout | 4,364 | N/A | |||
| Labour win (new seat) | |||||
| Labour win (new seat) | |||||
| Labour win (new seat) | |||||
| Party | Candidate | Votes | % | ± | |
|---|---|---|---|---|---|
| Labour | M. Ajeeb | 3,911 | 80.7 | N/A | |
| Labour | D. Coughlin | 3,717 | |||
| Labour | I. Queriski | 3,597 | |||
| Conservative | D. Baggley | 933 | 19.3 | N/A | |
| Conservative | M. Qureshi | 771 | |||
| Conservative | Z. Khan | 734 | |||
| Majority | 2,978 | 61.5 | N/A | ||
| Turnout | 4,844 | N/A | |||
| Labour win (new seat) | |||||
| Labour win (new seat) | |||||
| Labour win (new seat) | |||||
| Party | Candidate | Votes | % | ± | |
|---|---|---|---|---|---|
| Conservative | F. Hillam | 2,193 | 51.2 | N/A | |
| Labour | F. Bastow | 2,087 | 48.8 | N/A | |
| Labour | A. Corina | 2,020 | |||
| Conservative | A. Hodgson | 2,016 | |||
| Labour | L. Kearns | 1,995 | |||
| Conservative | H. Thorne | 1,902 | |||
| Majority | 106 | 2.5 | N/A | ||
| Turnout | 4,280 | N/A | |||
| Conservative win (new seat) | |||||
| Labour win (new seat) | |||||
| Labour win (new seat) | |||||
| Party | Candidate | Votes | % | ± | |
|---|---|---|---|---|---|
| Conservative | G. Hodgson | 2,270 | 52.2 | N/A | |
| Conservative | Eric Pickles | 2,229 | |||
| Conservative | S. Midgley | 2,210 | |||
| Labour | C. Foster | 1,475 | 33.9 | N/A | |
| Labour | S. Cliff | 1,475 | |||
| Labour | H. Laws | 1,436 | |||
| Liberal | M. Kershaw | 604 | 13.9 | N/A | |
| Majority | 795 | 18.3 | N/A | ||
| Turnout | 4,349 | N/A | |||
| Conservative win (new seat) | |||||
| Conservative win (new seat) | |||||
| Conservative win (new seat) | |||||
| Party | Candidate | Votes | % | ± | |
|---|---|---|---|---|---|
| Labour | D. Birdsall | 2,990 | 64.2 | N/A | |
| Labour | B. Lynch | 2,664 | |||
| Labour | D. Mangham | 2,654 | |||
| Conservative | H. Midgley | 1,665 | 35.8 | N/A | |
| Conservative | R. George | 1,585 | |||
| Conservative | D. Owen | 1,448 | |||
| Majority | 1,325 | 28.5 | N/A | ||
| Turnout | 4,655 | N/A | |||
| Labour win (new seat) | |||||
| Labour win (new seat) | |||||
| Labour win (new seat) | |||||
References
| Metropolitan boroughs |
|
|---|---|
| District councils (England) |
|
| District councils (Scotland) |
|
| City of Bradford Metropolitan District Council | |
|---|---|
| Calderdale Metropolitan Borough Council | |
| Kirklees Metropolitan Borough Council | |
| Leeds City Council | |
| Wakefield Metropolitan District Council | |
| West Yorkshire County Council | |
| West Riding County Council | |
| |
This article is issued from Wikipedia - version of the 10/19/2016. The text is available under the Creative Commons Attribution/Share Alike but additional terms may apply for the media files.