Dutch general election, 1986
Dutch general election, 1986
|
|
|
|
All 150 seats to the House of Representatives
76 seats were needed for a majority |
| Turnout |
85.8% |
| |
First party |
Second party |
Third party |
| |
 |
 |
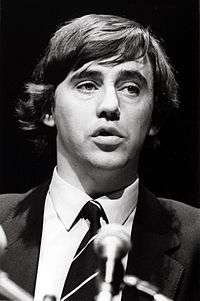 |
| Leader |
Ruud Lubbers |
Joop den Uyl |
Ed Nijpels |
| Party |
CDA |
PvdA |
VVD |
| Leader since |
1982 |
1966 |
1982 |
| Last election |
45 seats, 29.4% |
47 seats, 30.4% |
36 seats, 23.1% |
| Seats won |
54 |
52 |
27 |
| Seat change |
 9 9 |
 5 5 |
 9 9 |
| Popular vote |
3,172,918 |
3,051,678 |
1,596,991 |
| Percentage |
34.6% |
33.3% |
17.4% |
|
| |
Fourth party |
Fifth party |
Sixth party |
| |
 |
.jpg) |
 |
| Leader |
Hans van Mierlo |
Bas van der Vlies |
Ria Beckers |
| Party |
D66 |
SGP |
PPR |
| Leader since |
1986 |
1986 |
1977 |
| Last election |
6 seats, 4.3% |
3 seats, 1.8% |
2 seats, 1.7% |
| Seats won |
9 |
3 |
2 |
| Seat change |
 3 3 |
 0 0 |
 0 0 |
| Popular vote |
562,466 |
159,740 |
115,203 |
| Percentage |
6.1% |
1.7% |
1.3% |
|
| |
Seventh party |
Eighth party |
Ninth party |
| |
_in_Tweede_Kamer_-_NL-HaNA_Anefo_934-2284_WM624.jpg) |
 |
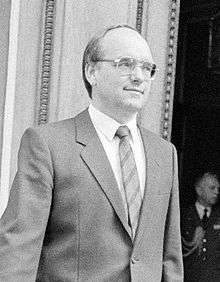 |
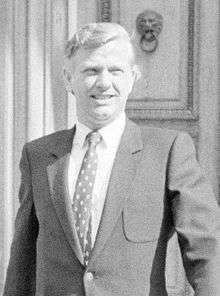
| Leader |
Andrée van Es |
Gert Schutte |
Meindert Leerling |
| Party |
PSP |
GPV |
RPF |
| Leader since |
1985 |
1981 |
1980 |
| Last election |
3 seats, 2.3% |
1 seats, 0.8% |
2 seats, 1.5% |
| Seats won |
1 |
1 |
1 |
| Seat change |
 2 2 |
 0 0 |
 1 1 |
| Popular vote |
110,182 |
88,381 |
83,582 |
| Percentage |
1.2% |
1.0% |
0.9% |
|
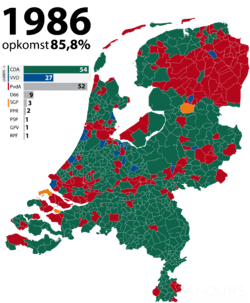
|
|
|
General elections were held in the Netherlands on 21 May 1986.[1] The Christian Democratic Appeal emerged as the largest party, winning 54 of the 150 seats in the House of Representatives.[2]
Results
| Party |
Votes |
% |
Seats |
+/– |
|---|
| Christian Democratic Appeal | 3,172,918 | 34.6 | 54 | +9 |
| Labour Party | 3,051,678 | 33.3 | 52 | +5 |
| People's Party for Freedom and Democracy | 1,596,991 | 17.4 | 27 | –9 |
| Democrats 66 | 562,466 | 6.1 | 9 | +3 |
| Reformed Political Party | 159,740 | 1.7 | 3 | 0 |
| Political Party of Radicals | 115,203 | 1.3 | 2 | 0 |
| Pacifist Socialist Party | 110,182 | 1.2 | 1 | –2 |
| Reformed Political League | 88,381 | 1.0 | 1 | 0 |
| Reformatory Political Federation | 83,582 | 0.9 | 1 | –1 |
| Anti Revolutionaries '85 | 231,018 | 2.5 | 0 | New |
| Brummer List | 0 | New |
| Centre Democrats | 0 | New |
| Centre Party | 0 | –1 |
| Communist Party of the Netherlands | 0 | –3 |
| Evangelical People's Party | 0 | –1 |
| Federation of Greens | 0 | New |
| God with Us | 0 | 0 |
| Humanist Party | 0 | New |
| Loesje | 0 | New |
| General Interest Party | 0 | New |
| Partij voor Ambtenaren & Trendvolgers | 0 | New |
| League of Communists in the Netherlands | 0 | New |
| Luck for Everyone Party | 0 | New |
| Party for the Middle Groups | 0 | New |
| Socialist Workers' Party | 0 | New |
| Socialist Party | 0 | 0 |
| Wissen List | 0 | New |
| Invalid/blank votes | 27,462 | – | – | – |
| Total | 9,199,621 | 100 | 150 | 0 |
| Registered voters/turnout | 10,727,701 | 85.8 | – | – |
| Source: Nohlen & Stöver |
| Popular Vote |
|---|
|
|
|
|
|
| CDA |
|
34.59% |
| PvdA |
|
33.27% |
| VVD |
|
17.41% |
| D66 |
|
6.13% |
| SGP |
|
1.74% |
| PPR |
|
1.26% |
| PSP |
|
1.20% |
| GPV |
|
0.96% |
| RPF |
|
0.91% |
| CPN |
|
0.63% |
| SP |
|
0.35% |
| Other |
|
1.54% |
References
- ↑ Nohlen, D & Stöver, P (2010) Elections in Europe: A data handbook, p1396 ISBN 978-3-8329-5609-7
- ↑ Nohlen & Stöver, p1414
Further reading
- Gladdish, Ken. "The Centre Holds: the 1986 Netherlands Election," West European Politics (1987). 10#1 pp. 115-119


.jpg)

_in_Tweede_Kamer_-_NL-HaNA_Anefo_934-2284_WM624.jpg)


