Havant Borough Council election, 2002
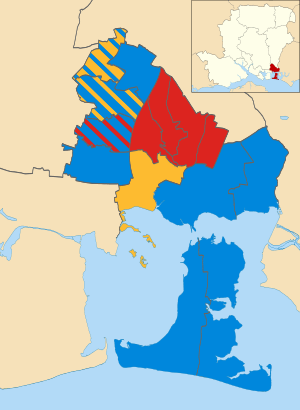
Map of the results of the 2002 Havant Borough Council election. Conservatives in blue, Labour in red and Liberal Democrats in yellow.
The 2002 Havant Borough Council election took place on 2 May 2002 to elect members of Havant Borough Council in Hampshire, England. The whole council was up for election after boundary changes reduced the number of seats by 4.[1] The Conservative party gained overall control of the council from no overall control.[2]
Election result
The Conservatives won a majority on the council, taking 23 of the 38 seats on the council.[3] Labour dropped from 11 to 9 seats, while the Liberal Democrats fell to 6 seats from 8 previously.[3] The 3 independent councillors had stood down at the election, while the boundary changes were reported to have cost Labour 4 seats.[3] Turnout was up on the 2000 election, but dropped to a low of just 14.6% in Warren Park ward.[3]
| Havant local election result 2002[2][4] | ||||||||||
|---|---|---|---|---|---|---|---|---|---|---|
| Party | Seats | Gains | Losses | Net gain/loss | Seats % | Votes % | Votes | +/− | ||
| Conservative | 23 | +3 | 60.5 | 52.6 | 34,315 | +2.4% | ||||
| Labour | 9 | -2 | 23.7 | 19.7 | 12,822 | +3.8% | ||||
| Liberal Democrat | 6 | -2 | 15.8 | 24.1 | 15,693 | -5.2% | ||||
| Green | 0 | 0 | 0 | 3.2 | 2,077 | +3.2% | ||||
| Independent | 0 | -3 | 0 | 0.4 | 289 | -4.0% | ||||
Ward results
| Party | Candidate | Votes | % | ± | |
|---|---|---|---|---|---|
| Labour | Ralph Cousins | 416 | |||
| Labour | Ronald Hoyle | 406 | |||
| Liberal Democrat | Peter Lake | 235 | |||
| Conservative | Sheila Culley | 195 | |||
| Conservative | Carol Wynne | 164 | |||
| Turnout | 1,416 | 18.9 | |||
| Party | Candidate | Votes | % | ± | |
|---|---|---|---|---|---|
| Labour | June Hanan | 529 | |||
| Labour | Paul Hansford | 476 | |||
| Conservative | Jane Rayner | 267 | |||
| Conservative | Ian Beagley | 238 | |||
| Liberal Democrat | Cecil Sargent | 212 | |||
| Turnout | 1,722 | 20.3 | |||
| Party | Candidate | Votes | % | ± | |
|---|---|---|---|---|---|
| Liberal Democrat | Ronald Bellinger | 1,408 | |||
| Liberal Democrat | Stephen Marshall | 1,224 | |||
| Liberal Democrat | Anthony Welch | 1,134 | |||
| Conservative | Kenneth Harris | 1,127 | |||
| Conservative | Angela Guest | 1,111 | |||
| Conservative | Mark Ward | 1,066 | |||
| Labour | William Fish | 285 | |||
| Labour | Carl Roberts | 258 | |||
| Labour | John Jackson | 254 | |||
| Green | Terry Mitchell | 140 | |||
| Turnout | 8,007 | 40.9 | |||
| Party | Candidate | Votes | % | ± | |
|---|---|---|---|---|---|
| Labour | Barry Gardner | 803 | |||
| Labour | Terence Hart | 741 | |||
| Conservative | Mary Brown | 226 | |||
| Conservative | Jennifer Wride | 209 | |||
| Liberal Democrat | Valerie Gatenby | 187 | |||
| Turnout | 2,166 | 23.6 | |||
| Party | Candidate | Votes | % | ± | |
|---|---|---|---|---|---|
| Conservative | Anthony Briggs | 1,170 | |||
| Conservative | David Keast | 1,056 | |||
| Conservative | Marjorie Smallcorn | 999 | |||
| Liberal Democrat | Valerie Hartridge | 961 | |||
| Liberal Democrat | Flora Ponsonby | 766 | |||
| Turnout | 4,952 | 27.9 | |||
| Party | Candidate | Votes | % | ± | |
|---|---|---|---|---|---|
| Conservative | David Gillett | 1,842 | |||
| Conservative | David Colson | 1,788 | |||
| Conservative | Virginia Wilson-Smith | 1,727 | |||
| Liberal Democrat | Hugh Benzie | 1,056 | |||
| Liberal Democrat | Gillian Cosslett | 849 | |||
| Liberal Democrat | John Cosslett | 803 | |||
| Labour | Anna Fitter | 429 | |||
| Labour | William Gilchrist | 412 | |||
| Labour | Phillip Rees | 308 | |||
| Green | Michael Wood | 243 | |||
| Turnout | 9,457 | 42.8 | |||
| Party | Candidate | Votes | % | ± | |
|---|---|---|---|---|---|
| Liberal Democrat | Ronald Purkis | 896 | |||
| Liberal Democrat | Sheila Troke | 875 | |||
| Conservative | Leonard Shaw | 800 | |||
| Conservative | Jacqueline Branson | 758 | |||
| Liberal Democrat | Christine Pylee | 750 | |||
| Conservative | Gopa Chakrabarti | 673 | |||
| Independent | Kevin Ratcliffe | 289 | |||
| Turnout | 5,041 | 25.0 | |||
| Party | Candidate | Votes | % | ± | |
|---|---|---|---|---|---|
| Conservative | Gordon Erlebach | 1,381 | |||
| Conservative | David Collins | 1,311 | |||
| Conservative | Sheila Pearce | 1,311 | |||
| Labour | Michael Clarke | 561 | |||
| Labour | Lesley Marsden | 519 | |||
| Labour | Sheila Mealy | 500 | |||
| Liberal Democrat | John Clouting | 355 | |||
| Green | Frederick Gibson | 289 | |||
| Turnout | 6,227 | 32.8 | |||
| Party | Candidate | Votes | % | ± | |
|---|---|---|---|---|---|
| Conservative | Francis Pearce | 1,590 | |||
| Conservative | Victor Pierce-Jones | 1,565 | |||
| Conservative | David Weymouth | 1,426 | |||
| Labour | Susan Underwood | 433 | |||
| Labour | Graham Manning | 425 | |||
| Labour | Andrew Stacey | 409 | |||
| Liberal Democrat | Jill Allum | 390 | |||
| Green | Gillian Leek | 286 | |||
| Turnout | 6,524 | 34.6 | |||
| Party | Candidate | Votes | % | ± | |
|---|---|---|---|---|---|
| Conservative | Gwendoline Blackett | 1,500 | |||
| Conservative | David Farrow | 1,413 | |||
| Conservative | Hilary Farrow | 1,312 | |||
| Labour | William Wheeler | 485 | |||
| Labour | Howard Sherlock | 478 | |||
| Liberal Democrat | Rodney Crawford | 467 | |||
| Labour | Nicola Sherlock | 458 | |||
| Turnout | 6,113 | 30.8 | |||
| Party | Candidate | Votes | % | ± | |
|---|---|---|---|---|---|
| Conservative | June Fulcher | 1,531 | |||
| Conservative | David Guest | 1,393 | |||
| Conservative | Raymond Bolton | 1,389 | |||
| Liberal Democrat | Dennis West | 949 | |||
| Liberal Democrat | Liam Hutchings | 926 | |||
| Green | Timothy Dawes | 726 | |||
| Liberal Democrat | Roy Middleton | 692 | |||
| Labour | Beryl Francis | 430 | |||
| Labour | Alan Price | 341 | |||
| Labour | Derek Smith | 279 | |||
| Turnout | 8,656 | 45.4 | |||
| Party | Candidate | Votes | % | ± | |
|---|---|---|---|---|---|
| Conservative | Olwyn Kennedy | 747 | |||
| Conservative | Nigel Tarrant | 688 | |||
| Labour | Margaret Beauvoisin | 634 | |||
| Liberal Democrat | Leslie Voice | 428 | |||
| Green | Kevin Jacks | 393 | |||
| Labour | Kim Vassallo | 385 | |||
| Labour | Ronald Russell | 379 | |||
| Turnout | 3,654 | 21.4 | |||
| Party | Candidate | Votes | % | ± | |
|---|---|---|---|---|---|
| Labour | Richard Brown | 407 | |||
| Labour | Virginia Steel | 382 | |||
| Conservative | Thelma Carpenter | 178 | |||
| Conservative | Clive Colson | 164 | |||
| Liberal Democrat | Michael Ponsonby | 130 | |||
| Turnout | 1,261 | 14.6 | |||
| Party | Candidate | Votes | % | ± | |
|---|---|---|---|---|---|
| Liberal Democrat | Catherine Cole | unopposed | |||
| Conservative | Kenneth Moss | unopposed | |||
| Conservative | Geoffrey Tart | unopposed | |||
References
- ↑ "Havant". BBC News Online. Retrieved 15 June 2014.
- 1 2 "Election results - Local Elections". The Times. NewsBank. 3 May 2002. p. 6.
- 1 2 3 4 "Tories tighten control on redrawn borough". The News. 7 May 2002. Retrieved 15 June 2014.
- 1 2 3 4 5 6 7 8 9 10 11 12 13 14 15 "Local Council Election Results". Havant Borough Council. Internet Archive. Archived from the original on 4 June 2002. Retrieved 15 June 2014.
This article is issued from Wikipedia - version of the 7/20/2014. The text is available under the Creative Commons Attribution/Share Alike but additional terms may apply for the media files.