July 2000 lunar eclipse
| Total Lunar Eclipse July 16, 2000 | |
|---|---|
| Sequence of Central total eclipse | |
 The Moon's path through the Earth's shadow. | |
| Gamma | 0.0302 |
| Series (and member) | 129 (37) |
| Duration (hr:mn:sc) | |
| Totality | 1:47:00 |
| Partial | 3:56:38 |
| Penumbral | 6:17:54 |
| Contacts | |
| P1 | 10:46:38 UTC |
| U1 | 11:57:17 UTC |
| U2 | 13:02:05 UTC |
| Greatest | 13:55:36 UTC |
| U3 | 14:49:06 UTC |
| U4 | 15:53:55 UTC |
| P4 | 17:04:31 UTC |
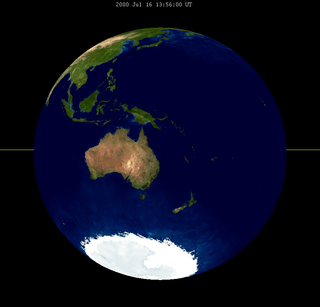
 The Moon passed straight through the center of the Earth's shadow at the descending node in Sagittarius of its orbit. Eastern Australia got the best views with mid eclipse occurring at midnight. | |
A total lunar eclipse took place on July 16, 2000, the second of two total lunar eclipses in 2000.
The Moon passed through the very center of the Earth's shadow. Totality lasted for 107 minutes, the longest duration since July 26, 1953 and August 13, 1859, and next longer won't be until the year 3000.
Visibility
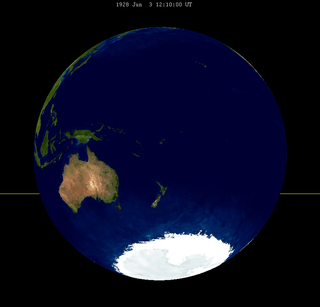
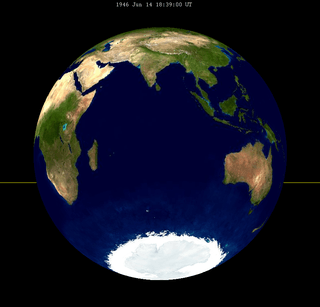
It could be seen completely over Australia, seen rising over Asia, and Eastern Africa, and setting over Western North and South America.
Related eclipses
Lunar year series
| Lunar eclipse series sets from 1998–2002 | ||||||
|---|---|---|---|---|---|---|
| Descending node | Ascending node | |||||
| Saros | Date Viewing |
Type Chart |
Saros | Date Viewing |
Type Chart | |
| 109 | 1998 Aug 08 |
Penumbral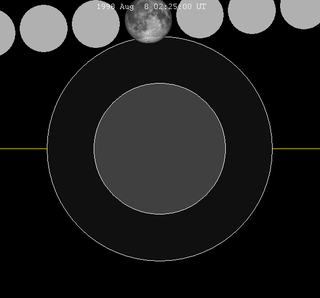 |
114 | 1999 Jan 31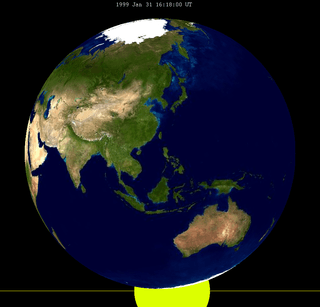 |
Penumbral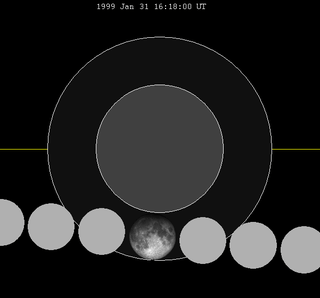 | |
| 119 | 1999 Jul 28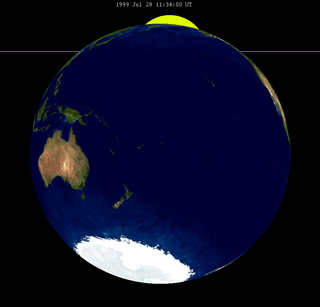 |
Partial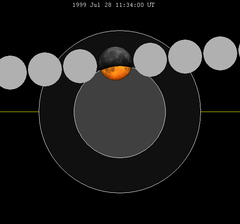 |
124 | 2000 Jan 21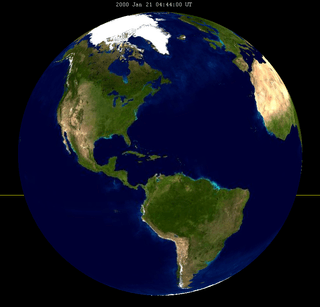 |
Total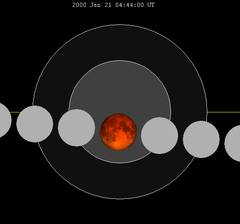 | |
| 129 | 2000 Jul 16 |
Total |
134 |
2001 Jan 09 |
Total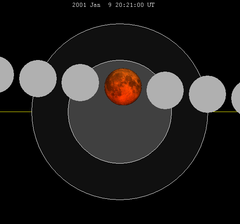 | |
| 139 |
2001 Jul 05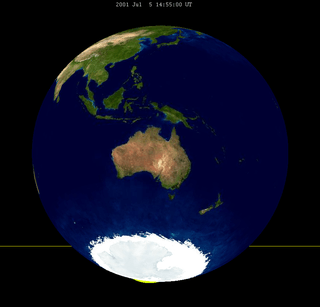 |
Partial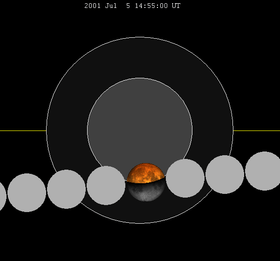 |
144 | 2001 Dec 30 |
Penumbral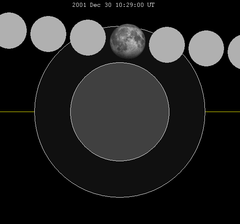 | |
| 149 | 2002 Jun 24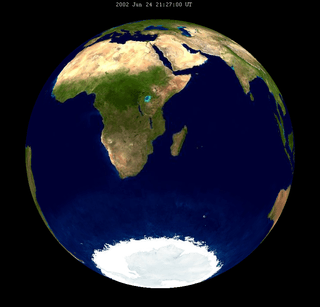 |
Penumbral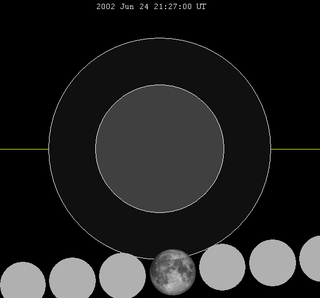 | ||||
| Last set | 1998 Sep 06 | Last set | 1998 Mar 13 | |||
| Next set | 2002 May 26 | Next set | 2002 Nov 20 | |||
Saros series
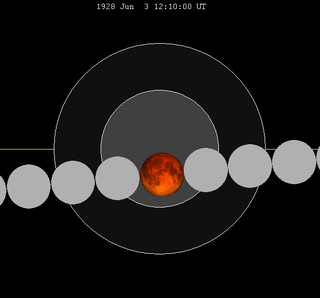
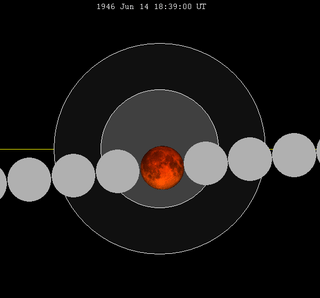
Lunar saros cycle series 129, repeating every 18 years and 11 days, has a total of 71 lunar eclipse events including 11 total lunar eclipses.
| Greatest | First | |||
|---|---|---|---|---|
 The greatest eclipse of the series occurred on 2000 Jul 16, lasting 108 minutes.[1] |
Penumbral | Partial | Total | Central |
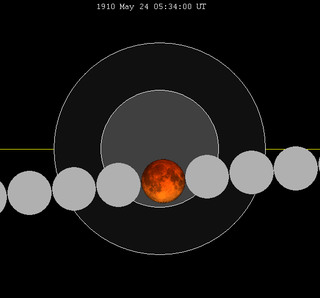
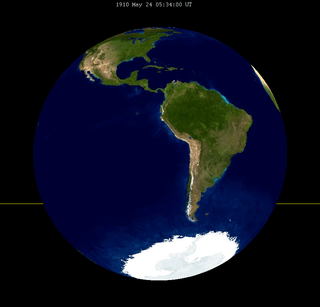
| 1351 Jun 10 | 1513 Sep 15 | 1910 May 24 | 1946 Jun 14 | |
| Last | ||||
| Central | Total | Partial | Penumbral | |
| 2036 Aug 7 | 2090 Sep 8 | 2469 Apr 26 | 2613 Jul 24 | |
| 1910 May 24 | 1928 Jun 3 | 1946 Jun 14 | |||
 |
 |
 |
 |
 |
 |
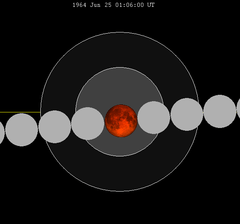
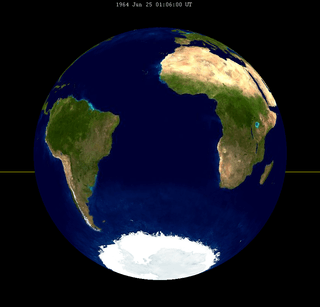
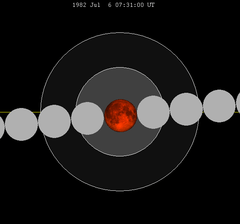
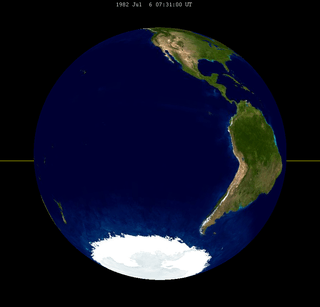
| 1964 Jun 25 | 1982 Jul 6 | 2000 Jul 16 | |||
 |
 |
 |
 |
 |
 |
| 2018 Jul 27 | 2036 Aug 7 | 2054 Aug 18 | |||
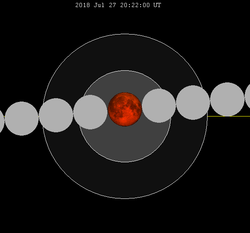 |
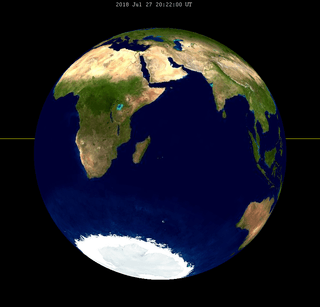 |
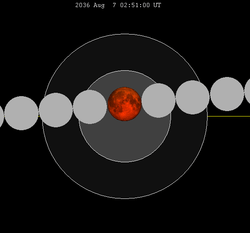 |
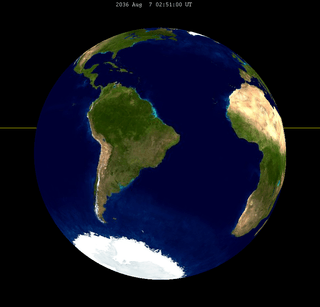 |
 |
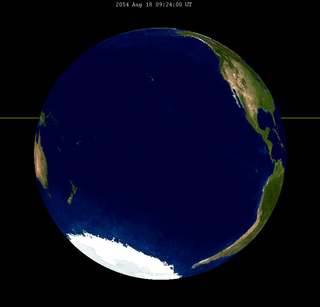 |
| 2072 Aug 28 | 2090 Sep 8 | ||||
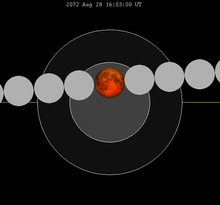 |
 |
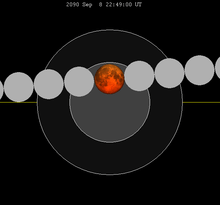 |
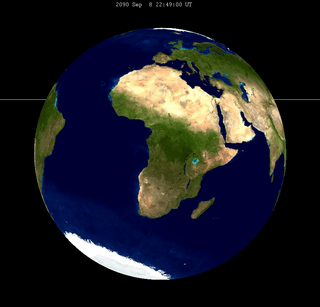 | ||
Tritos series
The tritos series repeats 31 days short of 11 years at alternating nodes. Sequential events have incremental Saros cycle indices.
This series produces 23 total eclipses between June 22, 1880 and August 9, 2120.
| Ascending node | Descending node | |||||
|---|---|---|---|---|---|---|
| Saros | Date Viewing |
Type chart |
Saros | Date Viewing |
Type chart | |
| 119 | 1902 Apr 22 |
Partial |
120 | 1913 Mar 22 |
Partial | |
| 121 | 1924 Feb 20 |
Partial |
122 | 1935 Jan 19 |
Partial | |
| 124 | 1945 Dec 19 |
Partial |
125 | 1956 Nov 18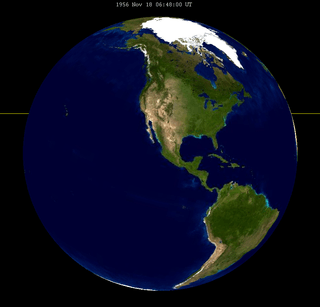 |
Total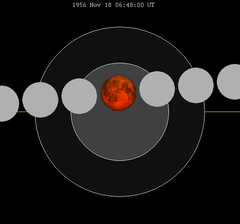 | |
| 126 | 1967 Oct 18 |
Total |
127 | 1978 Sep 16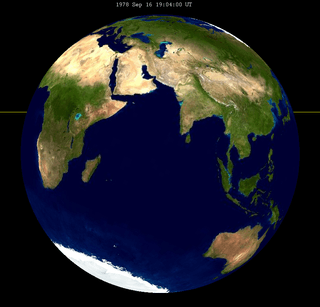 |
Total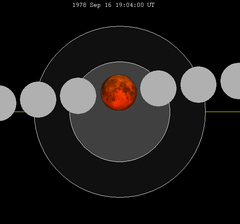 | |
| 128 | 1989 Aug 17 |
Total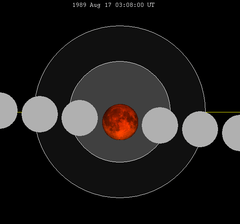 |
129 | 2000 Jul 16 |
Total | |
| 130 | 2011 Jun 15 |
Total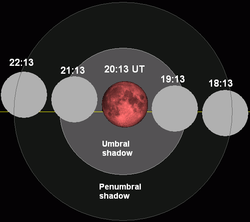 |
131 | 2022 May 16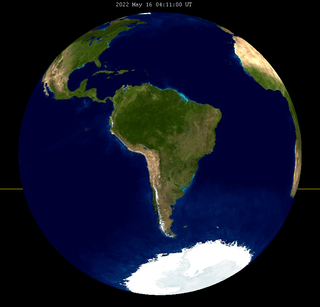 |
Total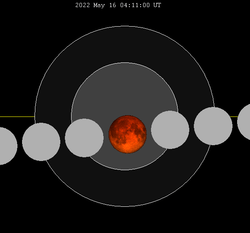 | |
| 132 | 2033 Apr 14 |
Total |
133 | 2044 Mar 13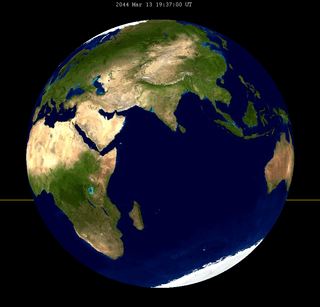 |
Total | |
| 134 | 2055 Feb 11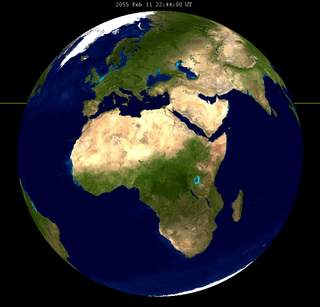 |
Total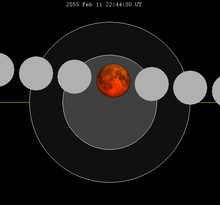 |
135 | 2066 Jan 11 |
Total | |
| 136 | 2076 Dec 10 |
Total |
137 | 2087 Nov 10 |
Total | |
| 138 | 2098 Oct 10 |
Total | ||||
Inex series
The inex series repeats eclipses 20 days short of 29 years, repeating on average every 10571.95 days. This period is equal to 358 lunations (synodic months) and 388.5 draconic months. Saros series increment by one on successive Inex events and repeat at alternate ascending and descending lunar nodes.
This period is 383.6734 anomalistic months (the period of the Moon's elliptical orbital precession). Despite the average 0.05 time-of-day shift between subsequent events, the variation of the Moon in its elliptical orbit at each event causes the actual eclipse time to vary significantly.
All events in this series shown (from 1000 to 2500 and beyond) are central total lunar eclipses.
| Descending node | Ascending node | Descending node | Ascending node | ||||
|---|---|---|---|---|---|---|---|
| Saros | Date | Saros | Date | Saros | Date | Saros | Date |
| 95 | 1016 May 24 | 96 | 1045 May 3 | 97 | 1074 Apr 14 | 98 | 1103 Mar 25 |
| 99 | 1132 Mar 3 | 100 | 1161 Feb 12 | 101 | 1190 Jan 23 | 102 | 1219 Jan 2 |
| 103 | 1247 Dec 13 | 104 | 1276 Nov 23 | 105 | 1305 Nov 2 | 106 | 1334 Oct 13 |
| 107 | 1363 Sep 23 | 108 | 1392 Sep 2 | 109 | 1421 Aug 13 | 110 | 1450 Jul 24 |
| 111 | 1479 Jul 4 | 112 | 1508 Jun 13 |
113 | 1537 May 24 | 114 | 1566 May 4 |
| 115 | 1595 Apr 24 | 116 | 1624 Apr 3 | 117 | 1653 Mar 14 | 118 | 1682 Feb 21 |
| 119 | 1711 Feb 3 | 120 | 1740 Jan 13 | 121 | 1768 Dec 23 | 122 | 1797 Dec 4 |
| 123 | 1826 Nov 14 | 124 | 1855 Oct 25 | 125 | 1884 Oct 4 | 126 | 1913 Sep 15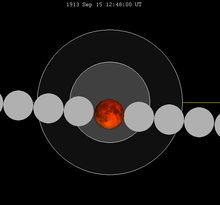 |
| 127 | 1942 Aug 26 |
128 | 1971 Aug 6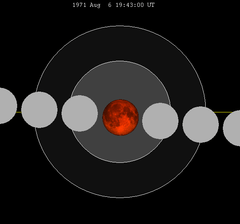 |
129 | 2000 Jul 16 |
130 | 2029 Jun 26 |
| 131 | 2058 Jun 6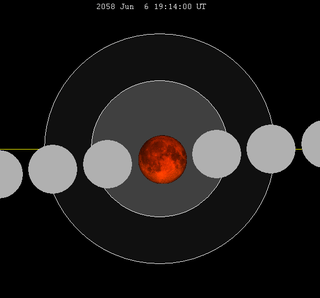 |
132 | 2087 May 17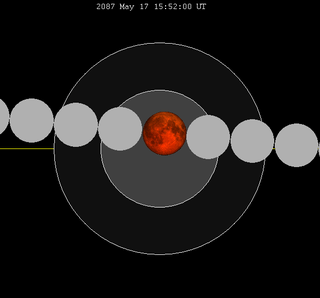 |
133 | 2116 Apr 27 | 134 | 2145 Apr 7 |
| 135 | 2174 Mar 18 | 136 | 2203 Feb 26 | 137 | 2232 Feb 7 | 138 | 2261 Jan 17 |
| 139 | 2289 Dec 27 | 140 | 2318 Dec 9 | 141 | 2347 Nov 19 | 142 | 2376 Oct 28 |
| 143 | 2405 Oct 8 | 144 | 2434 Sep 18 | 145 | 2463 Aug 29 | 146 | 2492 Aug 8 |
See also
Notes
External links
- Total Lunar Eclipse of 2000 July 16
- 2000 Jul 16 chart Eclipse Predictions by Fred Espenak, NASA/GSFC
- Total Lunar Eclipse July 16, 2000
- Lunar Eclipse Facts: July 16, 2000
- NASA Astronomy Picture of the Day: Newton Crater: Evidence for Recent Water on Mars (26 July 2000)
- Total Lunar Eclipse of 2000 July 16 A Report with Photographs ©2000 by Fred Espenak]
- Total lunar eclipse 16 July 2000, as seen from Wellington New Zealand
| Wikimedia Commons has media related to Lunar eclipse of 2000 July 16. |

