October 1967 lunar eclipse
| Total Lunar Eclipse October 18, 1967 | |
|---|---|
| (No photo) | |
 The moon passes west to east (right to left) across the Earth's umbral shadow, shown in hourly intervals. | |
| Series | 126 (43 of 72) |
| Duration (hr:mn:sc) | |
| Totality | |
| Partial | |
| Penumbral | |
| Contacts | |
| P1 | UTC |
| U1 | |
| U2 | |
| Greatest | |
| U3 | |
| U4 | |
| P4 | |
A total lunar eclipse took place on October 18, 1967.[1]
Visibility

Related lunar eclipses
Lunar year series
| Descending node | Ascending node | |||||
|---|---|---|---|---|---|---|
| Saros | Date Viewing |
Type Chart |
Saros | Date Viewing |
Type Chart | |
| 111 | 1966 May 4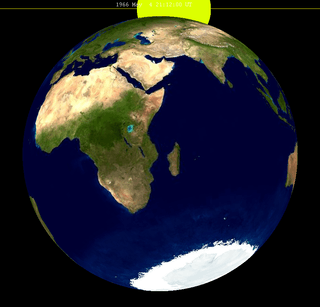 |
Penumbral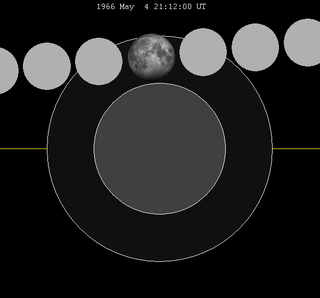 |
116 | 1966 Oct 29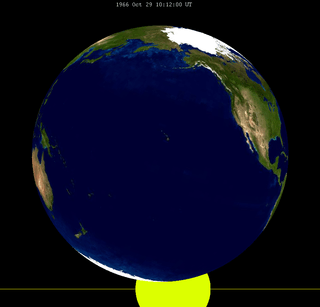 |
Penumbral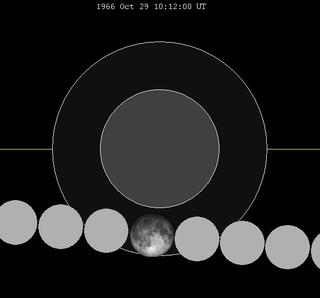 | |
| 121 | 1967 Apr 24 |
Total |
126 | 1967 Oct 18 |
Total | |
| 131 | 1968 Apr 13 |
Total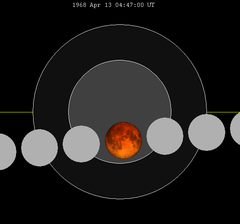 |
136 | 1968 Oct 6 |
Total | |
| 141 | 1969 Apr 2 |
Penumbral |
146 | 1969 Sep 25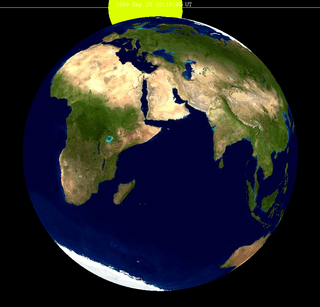 |
Penumbral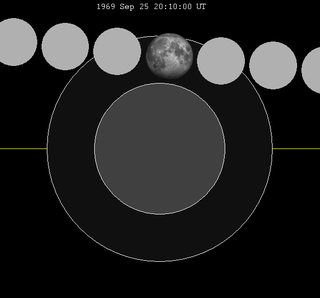 | |
| Last set | 1965 Jun 14 | Last set | 1965 Dec 8 | |||
| Next set | 1970 Feb 21 | Next set | 1969 Aug 27 | |||
Metonic series
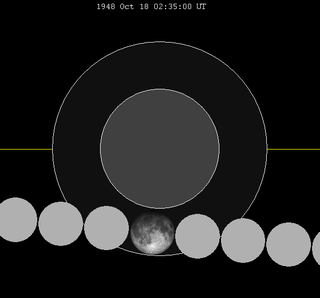
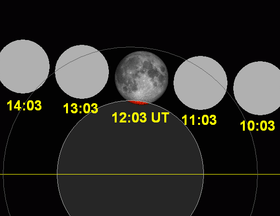
This eclipse is the third of four Metonic cycle lunar eclipses on the same date, April 23–24, each separated by 19 years:
The Metonic cycle repeats nearly exactly every 19 years and represents a Saros cycle plus one lunar year. Because it occurs on the same calendar date, the Earth's shadow will in nearly the same location relative to the background stars.
| Descending node | Ascending node | |||||
|---|---|---|---|---|---|---|
| Saros | Date | Type | Saros | Date | Type | |
| 111 | 1948 Apr 23 | Partial | 116 | 1948 Oct 18 | Penumbral | |
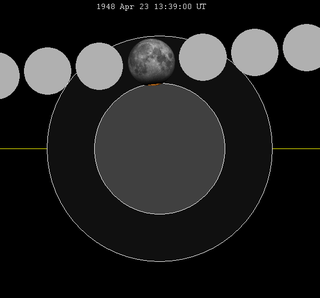 |
 | |||||
| 121 | 1967 Apr 24 | Total | 126 | 1967 Oct 18 | Total | |
 |
 | |||||
| 131 | 1986 Apr 24 | Total | 136 | 1986 Oct 17 | Total | |
 |
 | |||||
| 141 | 2005 Apr 24 | Penumbral | 146 | 2005 Oct 17 | Partial | |
 |
 | |||||
Tritos series
The tritos series repeats 31 days short of 11 years at alternating nodes. Sequential events have incremental Saros cycle indices.
This series produces 23 total eclipses between June 22, 1880 and August 9, 2120.
| Ascending node | Descending node | |||||
|---|---|---|---|---|---|---|
| Saros | Date Viewing |
Type chart |
Saros | Date Viewing |
Type chart | |
| 119 | 1902 Apr 22 |
Partial |
120 | 1913 Mar 22 |
Partial | |
| 121 | 1924 Feb 20 |
Partial |
122 | 1935 Jan 19 |
Partial | |
| 124 | 1945 Dec 19 |
Partial |
125 | 1956 Nov 18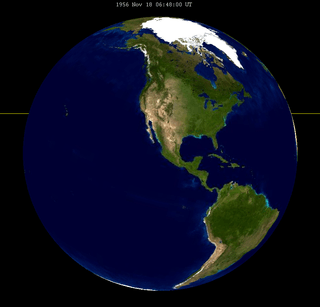 |
Total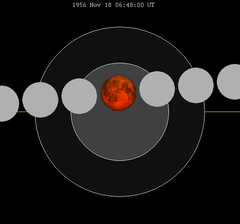 | |
| 126 | 1967 Oct 18 |
Total |
127 | 1978 Sep 16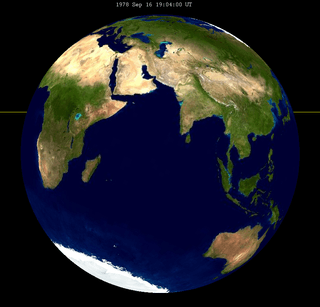 |
Total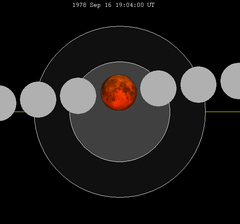 | |
| 128 | 1989 Aug 17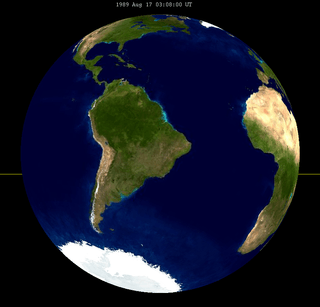 |
Total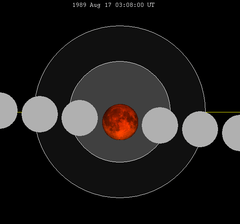 |
129 | 2000 Jul 16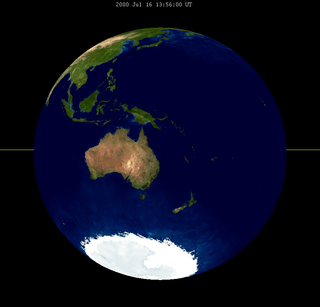 |
Total | |
| 130 | 2011 Jun 15 |
Total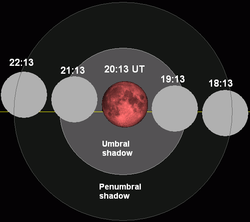 |
131 | 2022 May 16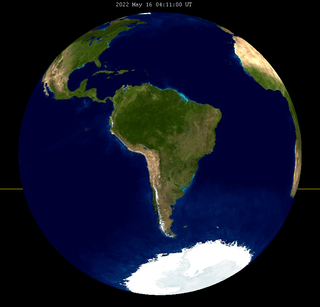 |
Total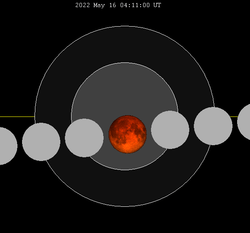 | |
| 132 | 2033 Apr 14 |
Total |
133 | 2044 Mar 13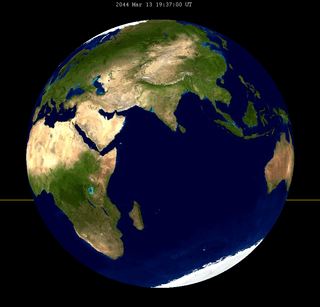 |
Total | |
| 134 | 2055 Feb 11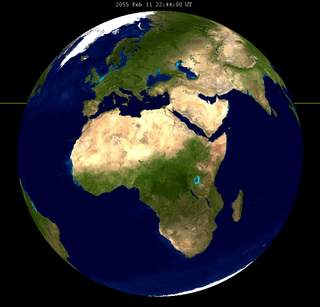 |
Total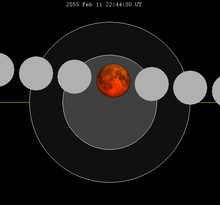 |
135 | 2066 Jan 11 |
Total | |
| 136 | 2076 Dec 10 |
Total |
137 | 2087 Nov 10 |
Total | |
| 138 | 2098 Oct 10 |
Total | ||||
See also
Notes
External links
- 1967 Oct 18 chart Eclipse Predictions by Fred Espenak, NASA/GSFC
This article is issued from Wikipedia - version of the 10/15/2015. The text is available under the Creative Commons Attribution/Share Alike but additional terms may apply for the media files.

