Results of the Victorian state election, 2010 (Legislative Assembly L-Z)
|
Victorian state election, 27 November 2010[1][2]
Legislative Assembly
<< 2006 — 2014 >> |
| Enrolled voters |
3,582,232 |
|
|
| Votes cast |
3,329,865 |
|
Turnout |
92.96 |
+0.23 |
| Informal votes |
165,134 |
|
Informal |
4.96 |
+0.40 |
| Summary of votes by party |
| Party |
Primary votes |
% |
Swing |
Seats |
Change |
| |
Liberal |
1,203,654 |
38.03 |
+3.59 |
35 |
+12 |
| |
Labor |
1,147,348 |
36.25 |
–6.81 |
43 |
–12 |
| |
Greens |
354,697 |
11.21 |
+1.17 |
0 |
±0 |
| |
National |
213,492 |
6.75 |
+1.58 |
10 |
+1 |
| |
Family First |
72,354 |
2.29 |
–2.00 |
0 |
±0 |
| |
Country Alliance |
42,938 |
1.36 |
+1.36 |
0 |
±0 |
| |
Democratic Labor |
28,176 |
0.89 |
+0.89 |
0 |
±0 |
| |
Sex Party |
17,252 |
0.55 |
+0.55 |
0 |
±0 |
| |
Socialist Alliance |
1,787 |
0.06 |
+0.02 |
0 |
±0 |
| |
Christian Democrats |
636 |
0.02 |
+0.02 |
0 |
±0 |
| |
Other |
82,395 |
2.60 |
+0.31 |
0 |
–1 |
| Total |
3,164,729 |
|
|
88 |
|
| Two-party-preferred |
| |
Liberal/National |
1,633,312 |
51.58 |
+5.97 |
|
|
| |
Labor |
1,533,225 |
48.42 |
–5.97 |
|
|
This is a list of electoral district results for the Victorian 2010 election for the Legislative Assembly from L to Z.
Results by electoral district
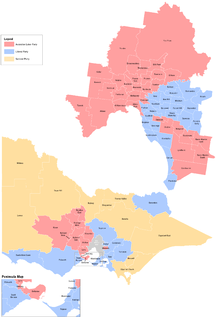
Lower house seat outcome of the Victorian 2010 election
Lara
Victorian state election, 2010: Lara
| Party |
Candidate |
Votes |
% |
± |
|
Labor |
John Eren |
20,778 |
53.61 |
-5.59 |
|
Liberal |
Robert Eyton |
11,366 |
29.33 |
+3.39 |
|
Greens |
Rob Leach |
3,401 |
8.77 |
+2.12 |
|
Family First |
Glenn Colla |
2,324 |
6.00 |
-2.21 |
|
Country Alliance |
Keith McDermott |
889 |
2.29 |
+2.29 |
| Total formal votes |
38,758 |
94.23 |
+0.25 |
| Informal votes |
2,373 |
5.77 |
-0.25 |
| Turnout |
41,131 |
93.29 |
+0.68 |
| Two-party-preferred result
|
|
Labor |
John Eren |
25,299 |
65.40 |
-2.53 |
|
Liberal |
Robert Eyton |
13,387 |
34.60 |
+2.53 |
|
Labor hold |
Swing |
-2.53 |
|
Lowan
Victorian state election, 2010: Lowan
| Party |
Candidate |
Votes |
% |
± |
|
National |
Hugh Delahunty |
23,702 |
67.42 |
+19.75 |
|
Labor |
Mandy Kirsopp |
7,783 |
22.14 |
-0.23 |
|
Greens |
Ben Wilkie |
1,966 |
5.59 |
+1.34 |
|
Family First |
Randall Reimer |
1,704 |
4.85 |
+1.50 |
| Total formal votes |
35,155 |
96.27 |
-0.15 |
| Informal votes |
1,363 |
3.73 |
+0.15 |
| Turnout |
36,518 |
94.91 |
+0.17 |
| Two-party-preferred result
|
|
National |
Hugh Delahunty |
25,337 |
72.08 |
0.00 |
|
Labor |
Mandy Kirsopp |
9,812 |
27.92 |
0.00 |
|
National hold |
Swing |
0.00 |
|
Lyndhurst
Victorian state election, 2010: Lyndhurst
| Party |
Candidate |
Votes |
% |
± |
|
Labor |
Tim Holding |
19,820 |
55.47 |
-9.82 |
|
Liberal |
Tony Holland |
9,946 |
27.83 |
+5.14 |
|
Greens |
Nina Springle |
2,191 |
6.13 |
+1.72 |
|
Family First |
Heather Wheatley |
1,744 |
4.88 |
-1.54 |
|
Independent |
Hung Vo |
1,277 |
3.57 |
+3.57 |
|
Democratic Labor |
Yien Wang |
444 |
1.24 |
+1.24 |
|
Independent |
Gordon Ford |
311 |
0.87 |
-0.31 |
| Total formal votes |
35,733 |
92.94 |
-0.43 |
| Informal votes |
2,715 |
7.06 |
+0.43 |
| Turnout |
38,448 |
92.47 |
-0.21 |
| Two-party-preferred result
|
|
Labor |
Tim Holding |
22,912 |
63.91 |
-7.57 |
|
Liberal |
Tony Holland |
12,941 |
36.09 |
+7.57 |
|
Labor hold |
Swing |
-7.57 |
|
Macedon
Victorian state election, 2010: Macedon
| Party |
Candidate |
Votes |
% |
± |
|
Liberal |
Tristan Weston |
18,141 |
42.32 |
+11.01 |
|
Labor |
Joanne Duncan |
17,282 |
40.31 |
-5.06 |
|
Greens |
Nicky Haslinghouse |
3,613 |
8.43 |
+0.37 |
|
Family First |
Judith Hungerford |
1,049 |
2.45 |
-0.15 |
|
Independent |
Mahinda Samararatna |
886 |
2.07 |
+2.07 |
|
Democratic Labor |
Sharon Lane |
700 |
1.63 |
+1.63 |
|
Country Alliance |
Gavin Greaves |
683 |
1.59 |
+1.59 |
|
Independent |
Lorraine Beyer |
516 |
1.20 |
+1.20 |
| Total formal votes |
42,870 |
94.81 |
-1.40 |
| Informal votes |
2,349 |
5.19 |
+1.40 |
| Turnout |
45,219 |
94.51 |
-0.27 |
| Two-party-preferred result
|
|
Labor |
Joanne Duncan |
22,061 |
51.27 |
-6.90 |
|
Liberal |
Tristan Weston |
20,970 |
48.73 |
+6.90 |
|
Labor hold |
Swing |
-6.90 |
|
Malvern
Melbourne
Victorian state election, 2010: Melbourne
| Party |
Candidate |
Votes |
% |
± |
|
Labor |
Bronwyn Pike |
13,116 |
35.67 |
-8.89 |
|
Greens |
Brian Walters |
11,735 |
31.92 |
+4.51 |
|
Liberal |
Luke Martin |
10,281 |
27.96 |
+5.88 |
|
Sex Party |
Rory Killen |
1,061 |
2.89 |
+2.89 |
|
Independent |
Peter Lazzari |
231 |
0.63 |
+0.63 |
|
Independent |
John Perkins |
201 |
0.55 |
+0.55 |
|
Independent |
Maxine Fensom |
142 |
0.39 |
+0.39 |
| Total formal votes |
36,767 |
96.31 |
-0.01 |
| Informal votes |
1,409 |
3.69 |
+0.01 |
| Turnout |
38,176 |
86.93 |
+2.09 |
| Two-party-preferred result
|
|
Labor |
Bronwyn Pike |
23,683 |
64.41 |
-7.0 |
|
Liberal |
Luke Martin |
13,084 |
35.59 |
+7.0 |
| Two-candidate-preferred result
|
|
Labor |
Bronwyn Pike |
20,510 |
55.76 |
+3.88 |
|
Greens |
Brian Walters |
16,273 |
44.24 |
-3.88 |
|
Labor hold |
Swing |
+3.88 |
|
Melton
Victorian state election, 2010: Melton
| Party |
Candidate |
Votes |
% |
± |
|
Labor |
Don Nardella |
18,520 |
49.44 |
-5.00 |
|
Liberal |
Braidy Kean |
11,615 |
31.01 |
+3.17 |
|
Greens |
Katrina Bradfield |
3,247 |
8.67 |
+2.24 |
|
Family First |
Samir Sabeh |
1,431 |
3.82 |
-2.80 |
|
Independent |
Matt DeLeon |
1,260 |
3.36 |
+3.36 |
|
Country Alliance |
Sav Mangion |
893 |
2.38 |
+2.38 |
|
Socialist Alliance |
Ron Guy |
494 |
1.32 |
+1.32 |
| Total formal votes |
37,460 |
92.75 |
-1.35 |
| Informal votes |
2,926 |
7.25 |
+1.35 |
| Turnout |
40,386 |
92.55 |
-0.49 |
| Two-party-preferred result
|
|
Labor |
Don Nardella |
23,525 |
62.78 |
-0.76 |
|
Liberal |
Braidy Kean |
13,947 |
37.22 |
+0.76 |
|
Labor hold |
Swing |
-0.76 |
|
Mildura
Victorian state election, 2010: Mildura
| Party |
Candidate |
Votes |
% |
± |
|
National |
Peter Crisp |
15,170 |
46.66 |
+6.43 |
|
Independent |
Glenn Milne |
5,209 |
16.02 |
+16.02 |
|
Labor |
Ali Cupper |
4,943 |
15.20 |
+8.54 |
|
Independent |
Doug Tonge |
4,696 |
14.44 |
+14.44 |
|
Family First |
Christopher Gray |
999 |
3.07 |
-0.51 |
|
Greens |
Gavin Rees |
563 |
1.73 |
-0.40 |
|
Democratic Labor |
Ross Douglass |
475 |
1.46 |
+1.46 |
|
Independent |
Anthony Connell |
457 |
1.41 |
+1.41 |
| Total formal votes |
32,512 |
94.17 |
-0.95 |
| Informal votes |
2,011 |
5.83 |
+0.95 |
| Turnout |
34,523 |
91.72 |
-0.44 |
| Two-candidate-preferred result
|
|
National |
Peter Crisp |
19,310 |
59.19 |
+3.39 |
|
Independent |
Glenn Milne |
13,312 |
40.81 |
+40.81 |
|
National hold |
Swing |
+3.39 |
|
Mill Park
Victorian state election, 2010: Mill Park
| Party |
Candidate |
Votes |
% |
± |
|
Labor |
Lily D'Ambrosio |
21,861 |
60.89 |
-1.16 |
|
Liberal |
Peter Chugha |
9,537 |
26.56 |
+4.30 |
|
Greens |
Gurm Sekhon |
2,605 |
7.26 |
+1.22 |
|
Family First |
Phillip Cogger |
1,901 |
5.29 |
-2.20 |
| Total formal votes |
35,904 |
93.66 |
-0.74 |
| Informal votes |
2,430 |
6.34 |
+0.74 |
| Turnout |
38,334 |
93.42 |
-1.31 |
| Two-party-preferred result
|
|
Labor |
Lily D'Ambrosio |
24,966 |
69.45 |
-1.34 |
|
Liberal |
Peter Chugha |
10,982 |
30.55 |
+1.34 |
|
Labor hold |
Swing |
-1.34 |
|
Mitcham
Monbulk
Mordialloc
Mornington
Morwell
Victorian state election, 2010: Morwell
| Party |
Candidate |
Votes |
% |
± |
|
National |
Russell Northe |
19,200 |
56.11 |
+28.52 |
|
Labor |
Graeme Middlemiss |
9,752 |
28.50 |
-12.07 |
|
Greens |
Dan Jordan |
1,645 |
4.81 |
-0.26 |
|
Country Alliance |
Peter Kelly |
1,226 |
3.58 |
+3.58 |
|
Independent |
Lou Sigmund |
968 |
2.83 |
+2.83 |
|
Independent |
Glyn Baker |
851 |
2.49 |
+2.49 |
|
Independent |
Peter Gardner |
574 |
1.68 |
+1.68 |
| Total formal votes |
34,216 |
94.90 |
-0.87 |
| Informal votes |
1,838 |
5.10 |
+0.87 |
| Turnout |
36,054 |
93.29 |
-0.41 |
| Two-party-preferred result
|
|
National |
Russell Northe |
22,726 |
66.26 |
+14.14 |
|
Labor |
Graeme Middlemiss |
11,572 |
33.74 |
-14.14 |
|
National hold |
Swing |
+14.14 |
|
Mount Waverley
Mulgrave
Victorian state election, 2010: Mulgrave
| Party |
Candidate |
Votes |
% |
± |
|
Labor |
Daniel Andrews |
15,392 |
50.68 |
-8.13 |
|
Liberal |
Courtney Mann |
11,166 |
36.77 |
+8.18 |
|
Greens |
John Janetzki |
2,173 |
7.16 |
+0.74 |
|
Family First |
Jim Johnson |
1,041 |
3.43 |
-2.75 |
|
Democratic Labor |
Geraldine Kokoszka |
596 |
1.96 |
+1.96 |
| Total formal votes |
30,368 |
93.62 |
-0.43 |
| Informal votes |
2,069 |
6.38 |
+0.43 |
| Turnout |
32,437 |
92.69 |
-0.36 |
| Two-party-preferred result
|
|
Labor |
Daniel Andrews |
17,779 |
58.48 |
-7.29 |
|
Liberal |
Courtney Mann |
12,623 |
41.52 |
+7.29 |
|
Labor hold |
Swing |
-7.29 |
|
Murray Valley
Victorian state election, 2010: Murray Valley
| Party |
Candidate |
Votes |
% |
± |
|
National |
Tim McCurdy |
18,357 |
53.83 |
+2.92 |
|
Labor |
Lachlan Enshaw |
7,065 |
20.72 |
-1.20 |
|
Independent |
Roberto Paino |
3,339 |
9.79 |
+9.79 |
|
Country Alliance |
Peter Watson |
2,668 |
7.82 |
+7.82 |
|
Greens |
Doug Ralph |
1,598 |
4.69 |
-0.75 |
|
Family First |
Ray Hungerford |
1,073 |
3.15 |
-1.00 |
| Total formal votes |
34,100 |
94.87 |
-1.43 |
| Informal votes |
1,845 |
5.13 |
+1.43 |
| Turnout |
35,945 |
93.75 |
+0.59 |
| Two-party-preferred result
|
|
National |
Tim McCurdy |
23,604 |
69.04 |
-2.72 |
|
Labor |
Lachlan Enshaw |
10,587 |
30.96 |
+2.72 |
|
National hold |
Swing |
-2.72 |
|
Narracan
Narre Warren North
Victorian state election, 2010: Narre Warren North
| Party |
Candidate |
Votes |
% |
± |
|
Labor |
Luke Donnellan |
15,043 |
42.52 |
-9.79 |
|
Liberal |
Michelle Frazer |
14,743 |
41.67 |
+8.03 |
|
Greens |
Michael Schilling |
2,443 |
6.91 |
-0.04 |
|
Family First |
Lissa McKenzie |
1,222 |
3.45 |
-2.53 |
|
Democratic Labor |
Carmen Sant |
1,041 |
3.09 |
+3.09 |
|
Independent |
Paul Richardson |
604 |
1.71 |
+1.71 |
|
Independent |
Taimour Hassan |
228 |
0.64 |
+0.64 |
| Total formal votes |
35,377 |
93.83 |
-1.65 |
| Informal votes |
2,325 |
6.17 |
+1.65 |
| Turnout |
37,702 |
93.78 |
+0.13 |
| Two-party-preferred result
|
|
Labor |
Luke Donnellan |
18,828 |
53.01 |
-6.22 |
|
Liberal |
Michelle Frazer |
16,692 |
46.99 |
+6.22 |
|
Labor hold |
Swing |
-6.22 |
|
Narre Warren South
Victorian state election, 2010: Narre Warren South
| Party |
Candidate |
Votes |
% |
± |
|
Labor |
Judith Graley |
22,007 |
47.95 |
-4.87 |
|
Liberal |
Gary Rowe |
17,402 |
37.92 |
+4.10 |
|
Greens |
Claus Endres |
3,244 |
7.07 |
+0.64 |
|
Family First |
Mark Konkel |
1,645 |
3.58 |
-3.36 |
|
Democratic Labor |
Nathan Dodd |
685 |
1.49 |
+1.49 |
|
Independent |
Ian George |
493 |
1.07 |
+1.07 |
|
Independent |
Angela Dunleavy |
416 |
0.91 |
+0.91 |
| Total formal votes |
45,892 |
93.67 |
-2.08 |
| Informal votes |
3,101 |
6.33 |
+2.08 |
| Turnout |
48,993 |
93.61 |
-0.60 |
| Two-party-preferred result
|
|
Labor |
Judith Graley |
26,109 |
56.74 |
-4.20 |
|
Liberal |
Gary Rowe |
19,910 |
43.26 |
+4.20 |
|
Labor hold |
Swing |
-4.20 |
|
Nepean
Niddrie
Victorian state election, 2010: Niddrie
| Party |
Candidate |
Votes |
% |
± |
|
Labor |
Rob Hulls |
14,435 |
45.68 |
-8.08 |
|
Liberal |
Joh Bauch |
11,000 |
34.81 |
+3.34 |
|
Greens |
Leharna Black |
2,451 |
7.76 |
-1.37 |
|
Independent |
Jim Little |
1,516 |
4.80 |
+4.80 |
|
Family First |
Mark Markovic |
1,263 |
4.00 |
-1.65 |
|
Independent |
Steve Medcraft |
499 |
1.58 |
+1.58 |
|
Independent |
Brian Roberts |
162 |
0.51 |
+0.51 |
|
Independent |
John Nott |
140 |
0.44 |
+0.44 |
|
Independent |
Robert Livesay |
131 |
0.41 |
+0.41 |
| Total formal votes |
31,597 |
91.69 |
-2.06 |
| Informal votes |
2,865 |
8.31 |
+2.06 |
| Turnout |
34,462 |
93.63 |
+0.12 |
| Two-party-preferred result
|
|
Labor |
Rob Hulls |
18,105 |
56.95 |
-4.27 |
|
Liberal |
Joh Bauch |
13,687 |
43.05 |
+4.27 |
|
Labor hold |
Swing |
-4.27 |
|
Northcote
Victorian state election, 2010: Northcote
| Party |
Candidate |
Votes |
% |
± |
|
Labor |
Fiona Richardson |
15,917 |
44.94 |
-7.63 |
|
Greens |
Anne Martinelli |
10,927 |
30.85 |
+3.44 |
|
Liberal |
Steve Moran |
6,863 |
19.37 |
+4.08 |
|
Sex Party |
Robert Bishop |
1,098 |
3.10 |
+3.10 |
|
Independent |
Darren Lewin-Hill |
404 |
1.14 |
-0.39 |
|
Independent |
Dominic Marino |
213 |
0.60 |
+0.60 |
| Total formal votes |
35,422 |
95.76 |
+0.41 |
| Informal votes |
1,567 |
4.24 |
-0.41 |
| Turnout |
36,989 |
91.50 |
+0.97 |
| Two-candidate-preferred result
|
|
Labor |
Fiona Richardson |
21,666 |
61.23 |
+2.71 |
|
Greens |
Anne Martinelli |
13,716 |
38.77 |
-2.71 |
|
Labor hold |
Swing |
+2.71 |
|
Oakleigh
Pascoe Vale
Polwarth
Victorian state election, 2010: Polwarth
| Party |
Candidate |
Votes |
% |
± |
|
Liberal |
Terry Mulder |
21,245 |
55.31 |
+1.79 |
|
Labor |
Brian Crook |
10,432 |
27.16 |
-1.76 |
|
Greens |
Natalie Atherden |
3,235 |
8.42 |
-1.19 |
|
Country Alliance |
Garry Kerr |
1,502 |
3.91 |
+3.91 |
|
Family First |
John Modra |
1,211 |
3.15 |
-1.11 |
|
Independent |
Grant Beale |
784 |
2.04 |
+2.04 |
| Total formal votes |
38,409 |
96.15 |
-0.34 |
| Informal votes |
1,539 |
3.85 |
+0.34 |
| Turnout |
39,948 |
94.94 |
+1.00 |
| Two-party-preferred result
|
|
Liberal |
Terry Mulder |
24,351 |
63.29 |
+2.60 |
|
Labor |
Brian Crook |
14,127 |
36.71 |
-2.60 |
|
Liberal hold |
Swing |
+2.60 |
|
Prahran
Victorian state election, 2010: Prahran
| Party |
Candidate |
Votes |
% |
± |
|
Liberal |
Clem Newton-Brown |
16,197 |
47.95 |
+6.08 |
|
Labor |
Tony Lupton |
9,384 |
27.78 |
-8.94 |
|
Greens |
Meni Christofakis |
6,685 |
19.79 |
-0.34 |
|
Sex Party |
Christian Vega |
1,073 |
3.18 |
+3.18 |
|
Independent |
Katharine Anderson |
239 |
0.71 |
+0.71 |
|
Family First |
Simon Ronchi |
198 |
0.59 |
-0.69 |
| Total formal votes |
33,776 |
96.77 |
+0.46 |
| Informal votes |
1,128 |
3.23 |
-0.46 |
| Turnout |
34,904 |
88.91 |
+3.94 |
| Two-party-preferred result
|
|
Liberal |
Clem Newton-Brown |
18,460 |
54.80 |
+8.33 |
|
Labor |
Tony Lupton |
15,226 |
45.20 |
-8.33 |
|
Liberal gain from Labor |
Swing |
+8.33 |
|
Preston
Richmond
Victorian state election, 2010: Richmond
| Party |
Candidate |
Votes |
% |
± |
|
Labor |
Richard Wynne |
13,328 |
37.26 |
-9.15 |
|
Greens |
Kathleen Maltzahn |
10,174 |
28.44 |
+3.76 |
|
Liberal |
Tom McFeely |
8,154 |
22.79 |
+2.91 |
|
Independent |
Stephen Jolly |
3,097 |
8.66 |
+3.02 |
|
Sex Party |
Angela White |
1,020 |
2.85 |
+2.85 |
| Total formal votes |
35,773 |
96.37 |
+0.80 |
| Informal votes |
1,348 |
3.63 |
-0.80 |
| Turnout |
37,121 |
88.33 |
+2.01 |
| Two-party-preferred result
|
|
Labor |
Richard Wynne |
25,130 |
70.25 |
-4.92 |
|
Liberal |
Tom McFeely |
10,643 |
29.75 |
+4.92 |
| Two-candidate-preferred result
|
|
Labor |
Richard Wynne |
20,212 |
56.46 |
+1.58 |
|
Greens |
Kathleen Maltzahn |
15,589 |
43.54 |
-1.58 |
|
Labor hold |
Swing |
+1.58 |
|
Ripon
Victorian state election, 2010: Ripon
| Party |
Candidate |
Votes |
% |
± |
|
Labor |
Joe Helper |
14,169 |
42.06 |
-4.73 |
|
Liberal |
Vic Dunn |
11,596 |
34.42 |
-0.84 |
|
National |
Wendy McIvor |
3,850 |
11.43 |
+2.92 |
|
Greens |
Steve Morse |
2,084 |
6.19 |
+0.23 |
|
Country Alliance |
Scott Watts |
1,211 |
3.59 |
+3.59 |
|
Family First |
Jesse Boer |
776 |
2.30 |
-1.18 |
| Total formal votes |
33,686 |
95.36 |
-0.94 |
| Informal votes |
1,640 |
4.64 |
+0.94 |
| Turnout |
35,326 |
93.90 |
-0.17 |
| Two-party-preferred result
|
|
Labor |
Joe Helper |
17,777 |
52.72 |
-1.63 |
|
Liberal |
Vic Dunn |
15,940 |
47.28 |
+1.63 |
|
Labor hold |
Swing |
-1.63 |
|
Rodney
Victorian state election, 2010: Rodney
| Party |
Candidate |
Votes |
% |
± |
|
National |
Paul Weller |
20,524 |
62.71 |
+22.55 |
|
Labor |
Vanessa Langford |
5,290 |
16.16 |
-1.97 |
|
Country Alliance |
Gino D'Angelo |
3,697 |
11.30 |
+11.30 |
|
Family First |
Serena Moore |
1,872 |
5.72 |
+2.33 |
|
Greens |
Ian Christoe |
1,348 |
4.12 |
+0.92 |
| Total formal votes |
32,731 |
95.59 |
+0.82 |
| Informal votes |
1,509 |
4.41 |
-0.82 |
| Turnout |
34,240 |
93.97 |
-0.34 |
| Two-party-preferred result
|
|
National |
Paul Weller |
24,947 |
76.16 |
+21.96 |
|
Labor |
Vanessa Langford |
7,809 |
23.84 |
+23.84 |
|
National hold |
Swing |
+21.96 |
|
Sandringham
Scoresby
Victorian state election, 2010: Scoresby
| Party |
Candidate |
Votes |
% |
± |
|
Liberal |
Kim Wells |
20,745 |
59.05 |
+5.93 |
|
Labor |
Garry Nightingale |
10,388 |
29.57 |
-2.82 |
|
Greens |
Salore Craig |
2,821 |
8.03 |
+1.52 |
|
Family First |
Rachel Hanna |
1,178 |
3.35 |
-3.42 |
| Total formal votes |
35,132 |
95.57 |
-0.36 |
| Informal votes |
1,627 |
4.43 |
+0.36 |
| Turnout |
36,759 |
93.96 |
-0.16 |
| Two-party-preferred result
|
|
Liberal |
Kim Wells |
22,259 |
64.14 |
+2.97 |
|
Labor |
Garry Nightingale |
12,598 |
35.86 |
-2.97 |
|
Liberal hold |
Swing |
+2.97 |
|
Seymour
Victorian state election, 2010: Seymour
| Party |
Candidate |
Votes |
% |
± |
|
Liberal |
Cindy McLeish |
12,992 |
35.63 |
-2.80 |
|
Labor |
Ben Hardman |
12,813 |
35.14 |
-11.28 |
|
Independent |
Jan Beer |
3,738 |
10.25 |
+10.25 |
|
Greens |
Huw Slater |
3,230 |
8.86 |
-0.47 |
|
Country Alliance |
Adam Taurian |
1,587 |
4.35 |
+4.35 |
|
National |
Anthony Rolando |
1,391 |
3.81 |
+3.81 |
|
Family First |
Robert Guerra |
711 |
1.95 |
-1.38 |
| Total formal votes |
36,462 |
94.91 |
-1.21 |
| Informal votes |
1,955 |
5.09 |
+1.21 |
| Turnout |
38,417 |
93.47 |
-0.55 |
| Two-party-preferred result
|
|
Liberal |
Cindy McLeish |
18,728 |
51.25 |
+8.07 |
|
Labor |
Ben Hardman |
17,811 |
48.75 |
-8.07 |
|
Liberal gain from Labor |
Swing |
+8.07 |
|
Shepparton
Victorian state election, 2010: Shepparton
| Party |
Candidate |
Votes |
% |
± |
|
National |
Jeanette Powell |
17,609 |
52.9 |
+4.5 |
|
Country Alliance |
Dennis Patterson |
6,826 |
20.5 |
+20.5 |
|
Labor |
Anthony Fullarton |
5,245 |
15.8 |
-3.2 |
|
Greens |
Lachlan Slade |
1,631 |
4.9 |
+0.2 |
|
Independent |
Paul Wickham |
958 |
2.9 |
+2.9 |
|
Family First |
Malcolm Moore |
769 |
2.3 |
+0.3 |
|
Independent |
Shannon Smith |
232 |
0.7 |
+0.7 |
| Total formal votes |
33,270 |
94.4 |
-0.6 |
| Informal votes |
1,955 |
5.6 |
+0.6 |
| Turnout |
35,225 |
92.4 |
-1.1 |
| Two-candidate-preferred result
|
|
National |
Jeanette Powell |
20,041 |
60.2 |
-14.4 |
|
Country Alliance |
Dennis Patterson |
13,329 |
39.8 |
+39.8 |
|
National hold |
Swing |
-14.4 |
|
South Barwon
Victorian state election, 2010: South Barwon
| Party |
Candidate |
Votes |
% |
± |
|
Liberal |
Andrew Katos |
20,133 |
45.93 |
+4.76 |
|
Labor |
Michael Crutchfield |
15,759 |
35.95 |
-7.99 |
|
Greens |
Simon Northeast |
4,208 |
9.60 |
+0.56 |
|
Independent |
Heather Wellington |
1,185 |
2.70 |
+2.70 |
|
Family First |
Kathleen O'Connor |
810 |
1.85 |
-2.81 |
|
Democratic Labor |
Alan Barron |
577 |
1.32 |
+1.32 |
|
Country Alliance |
Tony Leen |
547 |
1.25 |
+1.25 |
|
Independent |
John Dobinson |
323 |
0.74 |
+0.74 |
|
Independent |
Keith Oakley |
295 |
0.67 |
+0.67 |
| Total formal votes |
43,837 |
95.73 |
-1.20 |
| Informal votes |
1,955 |
4.27 |
+1.20 |
| Turnout |
45,792 |
94.79 |
+0.95 |
| Two-party-preferred result
|
|
Liberal |
Andrew Katos |
23,675 |
53.94 |
+6.34 |
|
Labor |
Michael Crutchfield |
20,218 |
46.06 |
-6.34 |
|
Liberal gain from Labor |
Swing |
+6.34 |
|
South-West Coast
Victorian state election, 2010: South-West Coast
| Party |
Candidate |
Votes |
% |
± |
|
Liberal |
Denis Napthine |
19,316 |
49.28 |
+3.98 |
|
Labor |
John Herbertson |
9,658 |
24.64 |
-13.68 |
|
Independent |
James Purcell |
4,519 |
11.53 |
+11.53 |
|
Greens |
Jack Howard |
3,228 |
8.24 |
+2.86 |
|
Country Alliance |
Tony Arscott |
1,394 |
3.56 |
+3.56 |
|
Family First |
Craig Haberfield |
1,081 |
2.76 |
-0.64 |
| Total formal votes |
39,196 |
95.97 |
+0.16 |
| Informal votes |
1,644 |
4.04 |
-0.16 |
| Turnout |
40,840 |
94.22 |
+0.85 |
| Two-party-preferred result
|
|
Liberal |
Denis Napthine |
24,252 |
61.90 |
+7.89 |
|
Labor |
John Herbertson |
14,926 |
38.10 |
-7.89 |
|
Liberal hold |
Swing |
+7.89 |
|
Swan Hill
Victorian state election, 2010: Swan Hill
| Party |
Candidate |
Votes |
% |
± |
|
National |
Peter Walsh |
22,086 |
75.04 |
+27.61 |
|
Labor |
Sharon Garrick |
4,802 |
16.32 |
-2.19 |
|
Greens |
Morgana Russell |
1,326 |
4.51 |
+0.57 |
|
Family First |
Garion Pearse |
1,219 |
4.14 |
+0.81 |
| Total formal votes |
29,433 |
95.33 |
+0.00 |
| Informal votes |
1,441 |
4.67 |
+0.00 |
| Turnout |
30,874 |
93.35 |
-0.42 |
| Two-party-preferred result
|
|
National |
Peter Walsh |
23,343 |
79.33 |
+5.93 |
|
Labor |
Sharon Garrick |
6,081 |
20.67 |
-5.93 |
|
National hold |
Swing |
+5.93 |
|
Tarneit
Victorian state election, 2010: Tarneit
| Party |
Candidate |
Votes |
% |
± |
|
Labor |
Tim Pallas |
20,521 |
49.08 |
-4.32 |
|
Liberal |
Glenn Goodfellow |
13,458 |
32.19 |
+4.64 |
|
Greens |
Bro Sheffield-Brotherton |
3,716 |
8.89 |
+2.51 |
|
Family First |
Lori McLean |
2,128 |
5.09 |
-1.29 |
|
Democratic Labor |
Michael Freeman |
1,988 |
4.75 |
+4.75 |
| Total formal votes |
41,811 |
94.38 |
-0.31 |
| Informal votes |
2,492 |
5.62 |
+0.31 |
| Turnout |
44,303 |
92.72 |
-1.11 |
| Two-party-preferred result
|
|
Labor |
Tim Pallas |
25,553 |
61.13 |
-1.34 |
|
Liberal |
Glenn Goodfellow |
16,248 |
38.87 |
+1.34 |
|
Labor hold |
Swing |
-1.34 |
|
Thomastown
Victorian state election, 2010: Thomastown
| Party |
Candidate |
Votes |
% |
± |
|
Labor |
Bronwyn Halfpenny |
19,190 |
61.29 |
-12.73 |
|
Liberal |
Michael Burge |
7,591 |
24.25 |
+9.47 |
|
Greens |
Andrew Calleja |
2,952 |
9.43 |
+2.87 |
|
Family First |
Jacquie McIntosh |
1,576 |
5.03 |
+0.39 |
| Total formal votes |
31,309 |
92.02 |
+0.14 |
| Informal votes |
2,716 |
7.98 |
-0.14 |
| Turnout |
34,025 |
92.33 |
-0.66 |
| Two-party-preferred result
|
|
Labor |
Bronwyn Halfpenny |
22,025 |
70.19 |
-10.88 |
|
Liberal |
Michael Burge |
9,356 |
29.81 |
+10.88 |
|
Labor hold |
Swing |
-10.88 |
|
Warrandyte
Victorian state election, 2010: Warrandyte
| Party |
Candidate |
Votes |
% |
± |
|
Liberal |
Ryan Smith |
22,150 |
58.53 |
+7.73 |
|
Labor |
Meghan Hopper |
9,920 |
26.21 |
-2.98 |
|
Greens |
Chris Padgham |
4,221 |
11.15 |
-3.19 |
|
Family First |
Yasmin De Zilwa |
1,106 |
2.92 |
-2.75 |
|
Independent |
Paul Slattery |
446 |
1.18 |
+1.18 |
| Total formal votes |
37,843 |
96.31 |
-0.39 |
| Informal votes |
1,448 |
3.69 |
+0.39 |
| Turnout |
39,291 |
94.74 |
+0.61 |
| Two-party-preferred result
|
|
Liberal |
Ryan Smith |
24,176 |
63.87 |
+4.88 |
|
Labor |
Meghan Hopper |
13,675 |
36.13 |
-4.88 |
|
Liberal hold |
Swing |
+4.88 |
|
Williamstown
Yan Yean
Victorian state election, 2010: Yan Yean
| Party |
Candidate |
Votes |
% |
± |
|
Labor |
Danielle Green |
20,990 |
42.90 |
-4.53 |
|
Liberal |
Jack Gange |
19,612 |
40.08 |
+5.45 |
|
Greens |
Karin Geradts |
4,916 |
10.05 |
+0.47 |
|
Democratic Labor |
Patrick Shea |
1,728 |
3.53 |
+3.53 |
|
Family First |
Andrew McPherson |
1,684 |
3.44 |
-0.02 |
| Total formal votes |
48,930 |
95.09 |
-1.11 |
| Informal votes |
2,527 |
4.91 |
+1.11 |
| Turnout |
51,457 |
95.05 |
+0.35 |
| Two-party-preferred result
|
|
Labor |
Danielle Green |
26,498 |
54.07 |
-3.92 |
|
Liberal |
Jack Gange |
22,506 |
45.93 |
+3.92 |
|
Labor hold |
Swing |
-3.92 |
|
Yuroke
Victorian state election, 2010: Yuroke
| Party |
Candidate |
Votes |
% |
± |
|
Labor |
Liz Beattie |
23,537 |
55.22 |
-7.99 |
|
Liberal |
Philip Cutler |
13,259 |
31.11 |
+7.18 |
|
Greens |
Graham Dawson |
4,128 |
9.68 |
+2.12 |
|
Family First |
Ian Cranson |
1,702 |
3.99 |
-1.30 |
| Total formal votes |
42,626 |
93.68 |
-1.42 |
| Informal votes |
2,876 |
6.32 |
+1.42 |
| Turnout |
45,502 |
93.96 |
-0.35 |
| Two-party-preferred result
|
|
Labor |
Liz Beattie |
27,841 |
65.29 |
-4.90 |
|
Liberal |
Philip Cutler |
14,802 |
34.71 |
+4.90 |
|
Labor hold |
Swing |
-4.90 |
|
See also
References