Sunderland City Council election, 2012
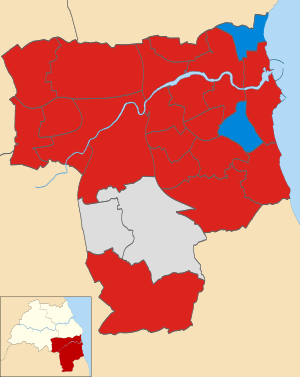
Map of the results of the 2012 Sunderland council election. Labour in red, Conservatives in blue and independent in grey.
The 2012 Sunderland Council election is scheduled to take place on 3 May 2012 to elect members of Sunderland Metropolitan Borough Council in England.[1] This will be on the same day as other United Kingdom local elections, 2012.
Ward results
An asterisk denotes an incumbent.
Barnes ward
| Party | Candidate | Votes | % | ± | |
|---|---|---|---|---|---|
| Labour | Rebecca Atkinson | 2,041 | 55.51 | +31.13 | |
| Conservative | Anthony Morrissey* | 1,486 | 40.41 | −11.18 | |
| Liberal Democrat | Gouilnara Dixon | 150 | 4.08 | −10.66 | |
| Majority | 555 | 15.09 | |||
| Turnout | 3,692 | 40.81 | +2.79 | ||
| Labour gain from Conservative | Swing | ||||
Castle ward
| Party | Candidate | Votes | % | ± | |
|---|---|---|---|---|---|
| Labour | Denny Wilson | 1,978 | 86.11 | +33.29 | |
| Conservative | Paula Wilkinson | 215 | 9.36 | −3.81 | |
| Liberal Democrat | Paul Hillman | 104 | 4.53 | −2.46 | |
| Majority | 1,763 | 76.75 | |||
| Turnout | 2,319 | 26.70 | −3.37 | ||
| Labour hold | Swing | ||||
Copt Hill ward
| Party | Candidate | Votes | % | ± | |
|---|---|---|---|---|---|
| Independent | Derrick Smith* | 1,679 | 55.23 | +9.59 | |
| Labour | Ann Owen | 1,250 | 41.12 | +6.65 | |
| Liberal Democrat | Sue Sterling | 111 | 3.65 | N/A | |
| Majority | 429 | 14.11 | |||
| Turnout | 3,052 | 33.59 | −3.15 | ||
| Independent hold | Swing | ||||
Doxford ward
| Party | Candidate | Votes | % | ± | |
|---|---|---|---|---|---|
| Labour | Christine Marshall | 1,863 | 67.14 | +32.14 | |
| Conservative | Richard Vardy* | 590 | 21.26 | −20.33 | |
| Green | Caroline Robinson | 246 | 8.86 | N/A | |
| Liberal Democrat | Matt MacDonald | 76 | 2.74 | −10.36 | |
| Majority | 1,273 | 45.87 | |||
| Turnout | 2,789 | 35.10 | −0.62 | ||
| Labour gain from Conservative | Swing | ||||
Fulwell ward
| Party | Candidate | Votes | % | ± | |
|---|---|---|---|---|---|
| Conservative | Bob Francis* | 1,758 | 48.12 | −5.04 | |
| Labour | Margaret Beck | 1,657 | 45.36 | +19.13 | |
| Liberal Democrat | Geoff Pryke | 238 | 6.52 | −5.15 | |
| Majority | 101 | 2.76 | |||
| Turnout | 3,670 | 39.96 | −3.53 | ||
| Conservative hold | Swing | ||||
Hendon ward
| Party | Candidate | Votes | % | ± | |
|---|---|---|---|---|---|
| Labour Co-op | Michael Mordey* | 1,518 | 66.55 | +30.15 | |
| Conservative | Debbie Lorraine | 360 | 15.78 | −5.75 | |
| UKIP | Pauline Featonby-Warren | 244 | 10.70 | N/A | |
| Green | Samuel May | 159 | 6.97 | N/A | |
| Majority | 1,158 | 50.77 | |||
| Turnout | 2,297 | 25.59 | −3.90 | ||
| Labour Co-op hold | Swing | ||||
Hetton ward
| Party | Candidate | Votes | % | ± | |
|---|---|---|---|---|---|
| Labour | James Blackburn* | 1,628 | 51.76 | −17.42 | |
| UKIP | John Defty | 1,363 | 43.34 | N/A | |
| Liberal Democrat | Philip Dowell | 154 | 4.90 | N/A | |
| Majority | 265 | 8.43 | |||
| Turnout | 3,166 | 35.12 | +4.50 | ||
| Labour hold | Swing | ||||
Houghton ward
| Party | Candidate | Votes | % | ± | |
|---|---|---|---|---|---|
| Independent | Sheila Ellis* | 1,697 | 51.94 | +7.12 | |
| Labour | Gemma Taylor | 1,496 | 45.79 | +8.79 | |
| Liberal Democrat | Louise Smith | 74 | 2.27 | N/A | |
| Majority | 201 | 6.15 | |||
| Turnout | 3,278 | 35.84 | +0.03 | ||
| Independent hold | Swing | ||||
Millfield ward
| Party | Candidate | Votes | % | ± | |
|---|---|---|---|---|---|
| Labour Co-op | Bob Price | 1,058 | 45.49 | +21.24 | |
| Liberal Democrat | Paul Dixon* | 888 | 38.18 | −7.85 | |
| Conservative | Keith O'Brien | 164 | 7.05 | −7.99 | |
| National Front | Paul Birleson | 122 | 5.25 | N/A | |
| Green | Helmut Izaks | 94 | 4.04 | N/A | |
| Majority | 170 | 7.31 | |||
| Turnout | 2,339 | 28.83 | −3.46 | ||
| Labour Co-op gain from Liberal Democrat | Swing | ||||
Pallion ward
| Party | Candidate | Votes | % | ± | |
|---|---|---|---|---|---|
| Labour | Amy Wilson* | 1,541 | 66.68 | +22.39 | |
| Conservative | Peter O'Connor | 365 | 15.79 | −11.28 | |
| Green | David Campbell | 304 | 13.15 | N/A | |
| Liberal Democrat | Sylvia Doward | 101 | 4.37 | −8.43 | |
| Majority | 1,176 | 50.89 | |||
| Turnout | 2,321 | 30.39 | −1.24 | ||
| Labour hold | Swing | ||||
Redhill ward
| Party | Candidate | Votes | % | ± | |
|---|---|---|---|---|---|
| Labour | Ronny Davison | 1,887 | 78.63 | +29.10 | |
| UKIP | Lynn Kelly | 388 | 16.17 | N/A | |
| Conservative | Gwennyth Gibson | 125 | 5.21 | −5.30 | |
| Majority | 1,499 | 62.46 | |||
| Turnout | 2,415 | 27.98 | −2.98 | ||
| Labour hold | Swing | ||||
Ryhope ward
| Party | Candidate | Votes | % | ± | |
|---|---|---|---|---|---|
| Labour Co-op | Anthony Farr | 1,887 | 72.77 | +40.05 | |
| Conservative | Shaun Cudworth | 706 | 27.23 | −6.46 | |
| Majority | 1,181 | 45.55 | |||
| Turnout | 2,620 | 31.90 | −5.37 | ||
| Labour Co-op gain from Conservative | Swing | ||||
St. Annes ward
| Party | Candidate | Votes | % | ± | |
|---|---|---|---|---|---|
| Labour | Susan Watson* | 1,743 | 72.05 | +26.74 | |
| Conservative | Norman Oliver | 339 | 14.01 | −7.96 | |
| Green | Emily Blyth | 268 | 11.08 | N/A | |
| Liberal Democrat | Kathy Walker | 69 | 2.85 | −12.59 | |
| Majority | 1,404 | 58.04 | |||
| Turnout | 2,426 | 28.02 | −1.48 | ||
| Labour hold | Swing | ||||
St. Chads ward
| Party | Candidate | Votes | % | ± | |
|---|---|---|---|---|---|
| Labour | Darryl Dixon | 1,755 | 55.33 | +18.78 | |
| Conservative | Alan Wright | 1,312 | 41.36 | −8.94 | |
| Liberal Democrat | Sue Wilson | 105 | 3.31 | −2.30 | |
| Majority | 443 | 13.97 | |||
| Turnout | 3,188 | 39.98 | −1.67 | ||
| Labour hold | Swing | ||||
St. Michaels ward
| Party | Candidate | Votes | % | ± | |
|---|---|---|---|---|---|
| Conservative | Margaret Forbes* | 1,649 | 51.29 | −8.87 | |
| Labour | Chris Johnson | 1,161 | 36.11 | +12.68 | |
| Green | Rachel Featherstone | 265 | 8.24 | N/A | |
| Liberal Democrat | Andrew Wood | 140 | 4.35 | −5.70 | |
| Majority | 488 | 15.18 | |||
| Turnout | 3,242 | 35.35 | −5.47 | ||
| Conservative hold | Swing | ||||
St. Peters ward
| Party | Candidate | Votes | % | ± | |
|---|---|---|---|---|---|
| Labour | Julia Jackson | 1,595 | 52.47 | +25.73 | |
| Conservative | Graham Hall | 1,221 | 40.16 | −7.61 | |
| Liberal Democrat | Chris Henry | 224 | 7.37 | −6.73 | |
| Majority | 374 | 12.30 | |||
| Turnout | 3,065 | 35.21 | −2.57 | ||
| Labour gain from Conservative | Swing | ||||
Sandhill ward
Two councillors were elected. Each voter could cast two votes.
| Party | Candidate | Votes | % | ± | |
|---|---|---|---|---|---|
| Labour | Debra Waller | 1,830 | 90.42 | +43.38 | |
| Labour | Mary Turton | 1,424 | 70.36 | +23.32 | |
| Conservative | Paul Tweddle | 459 | 22.68 | −3.35 | |
| Liberal Democrat | Anthony Usher | 335 | 16.55 | +3.69 | |
| Majority | 965 | 47.68 | |||
| Turnout | 2,035 | 23.80 | −6.87 | ||
| Labour hold | Swing | ||||
| Labour hold | Swing | ||||
Shiney Row ward
| Party | Candidate | Votes | % | ± | |
|---|---|---|---|---|---|
| Labour | Anne Hall | 2,286 | 73.55 | +25.14 | |
| Conservative | Malcolm Vardy | 635 | 20.43 | −7.30 | |
| Liberal Democrat | Carol Attewell | 187 | 6.02 | −7.05 | |
| Majority | 1,651 | 53.12 | |||
| Turnout | 3,129 | 30.77 | −2.58 | ||
| Labour hold | Swing | ||||
Silksworth ward
| Party | Candidate | Votes | % | ± | |
|---|---|---|---|---|---|
| Labour | Patricia Smith* | 1,960 | 67.24 | +17.96 | |
| Conservative | Dominic McDonough | 451 | 15.47 | −12.92 | |
| UKIP | Derek Horsley | 376 | 12.90 | N/A | |
| Green | Joella Lynch | 128 | 4.39 | N/A | |
| Majority | 1,509 | 51.77 | |||
| Turnout | 2,919 | 34.28 | −2.39 | ||
| Labour hold | Swing | ||||
Southwick ward
| Party | Candidate | Votes | % | ± | |
|---|---|---|---|---|---|
| Labour | Rosalind Copeland* | 1,582 | 66.41 | +22.92 | |
| Conservative | Terence Docherty | 394 | 16.54 | −9.99 | |
| UKIP | Michael Leadbitter | 325 | 13.64 | N/A | |
| Liberal Democrat | Ann Hollern | 81 | 3.40 | N/A | |
| Majority | 1,188 | 49.87 | |||
| Turnout | 2,394 | 28.59 | −4.12 | ||
| Labour hold | Swing | ||||
Washington Central ward
| Party | Candidate | Votes | % | ± | |
|---|---|---|---|---|---|
| Labour Co-op | Dianne Snowdon* | 1,999 | 65.73 | +25.45 | |
| UKIP | Erland Polden | 536 | 17.63 | N/A | |
| Conservative | Pat Francis | 327 | 10.75 | −15.40 | |
| Liberal Democrat | Chris Ashford | 179 | 5.89 | −17.38 | |
| Majority | 1,463 | 48.11 | |||
| Turnout | 3,058 | 33.94 | −2.34 | ||
| Labour Co-op hold | Swing | ||||
Washington East ward
| Party | Candidate | Votes | % | ± | |
|---|---|---|---|---|---|
| Labour | David Snowdon | 1,721 | 56.48 | +16.21 | |
| Conservative | Hilary Johnson | 735 | 24.12 | −19.05 | |
| UKIP | Linda Hudson | 316 | 10.37 | N/A | |
| Green | Tony Murphy | 156 | 5.12 | N/A | |
| Liberal Democrat | Malcolm Bannister | 119 | 3.91 | −8.60 | |
| Majority | 986 | 32.36 | |||
| Turnout | 3,055 | 34.55 | −2.53 | ||
| Labour gain from Conservative | Swing | ||||
Washington North ward
| Party | Candidate | Votes | % | ± | |
|---|---|---|---|---|---|
| Labour | John Kelly* | 2,047 | 80.09 | +27.04 | |
| Conservative | Kathleen Irvine | 349 | 13.65 | −8.60 | |
| Liberal Democrat | Kevin Morris | 160 | 6.26 | −6.73 | |
| Majority | 1,698 | 66.43 | |||
| Turnout | 2,577 | 28.96 | −3.32 | ||
| Labour hold | Swing | ||||
Washington South ward
| Party | Candidate | Votes | % | ± | |
|---|---|---|---|---|---|
| Labour | Louise Farthing | 1,802 | 65.10 | +27.48 | |
| Conservative | Martin Talbot | 757 | 27.35 | −15.18 | |
| Liberal Democrat | David Griffin | 209 | 7.55 | −4.96 | |
| Majority | 1,045 | 37.75 | |||
| Turnout | 2,797 | 33.91 | −3.57 | ||
| Labour gain from Conservative | Swing | ||||
Washington West ward
| Party | Candidate | Votes | % | ± | |
|---|---|---|---|---|---|
| Labour | Bernard Scaplehorn* | 2,200 | 77.46 | +31.36 | |
| Conservative | Olwyn Bird | 386 | 13.59 | −11.68 | |
| Liberal Democrat | Irene Bannister | 254 | 8.94 | −8.88 | |
| Majority | 1,814 | 63.87 | |||
| Turnout | 2,869 | 31.45 | −2.46 | ||
| Labour hold | Swing | ||||
References
- ↑ "Local elections 2012". BBC News. Retrieved 2012-04-30.
This article is issued from Wikipedia - version of the 10/10/2016. The text is available under the Creative Commons Attribution/Share Alike but additional terms may apply for the media files.