Kentucky's 6th congressional district
| Kentucky's 6th congressional district | ||
|---|---|---|
.tif.png) | ||
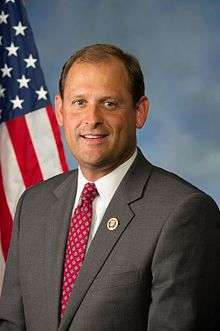
| Current Representative | Andy Barr (R–Lexington) | |
| Cook PVI | R+9[1] | |
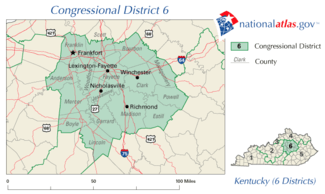
Kentucky's 6th congressional district is a congressional district in the U.S. state of Kentucky. Based in Central Kentucky, the district contains the cities of Lexington (including its suburbs), Richmond, and Frankfort, the state capital.
The district is currently represented by Republican Andy Barr.
Characteristics
As of September 2013, there were 507,252 registered voters: 293,915 (57.94%) Democrats, 171,722 (33.85%) Republicans, and 41,615 (8.20%) "Others". All of the "Others" included 29,934 (5.90%) unclassified Others, 10,760 (2.12%) Independents, 684 (0.13%) Libertarians, 166 (0.03%) Greens, 44 (0.0087%) Constitutionalists, 16 (0.0032%) Reforms, and 11 (0.0022%) Socialist Workers.[2][3]
Until January 1, 2006, Kentucky did not track party affiliation for registered voters who were neither Democratic nor Republican.[4] The Kentucky voter registration card does not explicitly list anything other than Democratic Party, Republican Party, or Other, with the "Other" option having a blank line and no instructions on how to register as something else.[5]
List of representatives
| Representative | Party | Years | District Residence | Notes |
|---|---|---|---|---|
| District created |
March 4, 1803 | |||
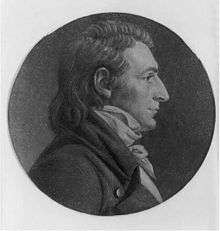 George M. Bedinger George M. Bedinger | March 4, 1803 – March 3, 1807 | |||
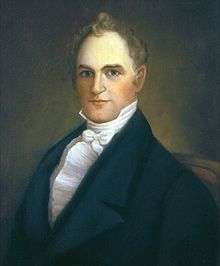 Joseph Desha Joseph Desha | March 4, 1807 – March 3, 1813 | Redistricted to the 4th district | ||
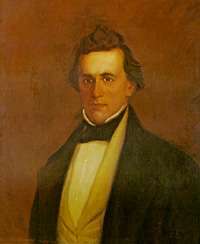
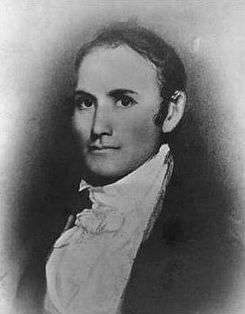 Solomon P. Sharp Solomon P. Sharp | March 4, 1813 – March 3, 1817 | |||
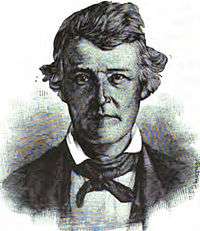
 David Walker David Walker | March 4, 1817 – March 1, 1820 | Died | ||
| Francis Johnson | November 13, 1820 – March 3, 1823 | Redistricted to the 10th district | ||
| David White | March 4, 1823 – March 3, 1825 | |||
| Joseph Lecompte | March 4, 1825 – March 3, 1833 | |||
| Thomas Chilton | March 4, 1833 – March 3, 1835 | |||
 John Calhoon John Calhoon | March 4, 1835 – March 3, 1837 | |||
| March 4, 1837 – March 3, 1839 | ||||
| Willis Green | March 4, 1839 – March 3, 1843 | Redistricted to the 2nd district | ||
 John White John White | March 4, 1843 – March 3, 1845 | Redistricted from the 9th district | ||
| John P. Martin | March 4, 1845 – March 3, 1847 | |||
| Green Adams | March 4, 1847 – March 3, 1849 | |||
| Daniel Breck | March 4, 1849 – March 3, 1851 | |||
| Addison White | March 4, 1851 – March 3, 1853 | |||
| John M. Elliott | March 4, 1853 – March 3, 1859 | |||
| Green Adams | March 4, 1859 – March 3, 1861 | |||
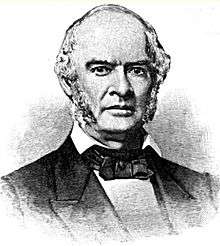 George W. Dunlap George W. Dunlap | March 4, 1861 – March 3, 1863 | |||
 Green C. Smith Green C. Smith | March 4, 1863 – July, 1866 | Resigned after being appointed Governor of Montana Territory | ||
 Andrew H. Ward Andrew H. Ward | December 3, 1866 – March 3, 1867 | |||
 Thomas L. Jones Thomas L. Jones | March 4, 1867 – March 3, 1871 | |||
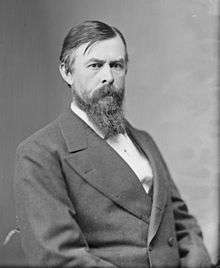
 William E. Arthur William E. Arthur | March 4, 1871 – March 3, 1875 | |||
| Thomas L. Jones | March 4, 1875 – March 3, 1877 | |||
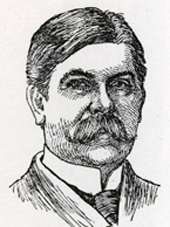
 John G. Carlisle John G. Carlisle | March 4, 1877 – May 26, 1890 | Resigned after being elected to U.S. Senate | ||
| William W. Dickerson | June 21, 1890 – March 3, 1893 | |||
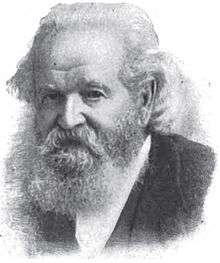
 Albert S. Berry Albert S. Berry | March 4, 1893 – March 3, 1901 | |||
 Daniel Linn Gooch Daniel Linn Gooch | March 4, 1901 – March 3, 1905 | |||
| Joseph L. Rhinock | March 4, 1905 – March 3, 1911 | |||
 Arthur B. Rouse Arthur B. Rouse | March 4, 1911 – March 3, 1927 | |||
| Orie S. Ware | March 4, 1927 – March 3, 1929 | |||
| J. Lincoln Newhall | March 4, 1929 – March 3, 1931 | |||
| Brent Spence | March 4, 1931 – March 3, 1933 | Redistricted to the at-large district | ||
| District redistricted to at-large district | March 4, 1933 | |||
| District re-established from at-large district | January 3, 1935 | |||
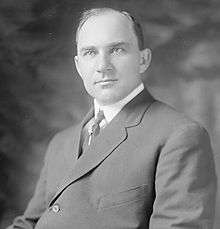
 Virgil Chapman Virgil Chapman | January 3, 1935 – January 3, 1949 | Redistricted from the At-large district | ||
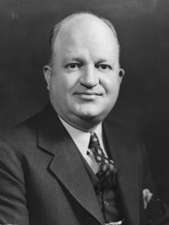
 Thomas R. Underwood Thomas R. Underwood | January 3, 1949 – March 17, 1951 | Resigned | ||
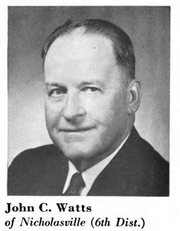 John C. Watts John C. Watts | April 4, 1951 – September 24, 1971 | Died | ||
| William P. Curlin, Jr. | December 4, 1971 – January 3, 1973 | |||
 John B. Breckinridge John B. Breckinridge | January 3, 1973 – January 3, 1979 | |||
 Larry Hopkins Larry Hopkins | January 3, 1979 – January 3, 1993 | |||
 Scotty Baesler Scotty Baesler | January 3, 1993 – January 3, 1999 | |||
 Ernie Fletcher Ernie Fletcher | January 3, 1999 – December 8, 2003 | Resigned after being elected Governor of Kentucky | ||
 Ben Chandler Ben Chandler | February 17, 2004 – January 3, 2013 | Defeated for re-election | ||
 Andy Barr Andy Barr | January 3, 2013 – Present | Incumbent | ||
Recent election results
2002
| Party | Candidate | Votes | % | |
|---|---|---|---|---|
| Republican | Ernie Fletcher* | 115,622 | 71.95 | |
| Independent | Gatewood Galbraith | 41,753 | 25.98 | |
| Libertarian | Mark Gailey | 3,313 | 2.06 | |
| Total votes | 160,688 | 100.00 | ||
| Voter turnout | % | |||
| Republican hold | ||||
2004
| Party | Candidate | Votes | % | |||
|---|---|---|---|---|---|---|
| Democratic | Ben Chandler | 84,168 | 55.16 | |||
| Republican | Alice Forgy Kerr | 65,474 | 42.91 | |||
| Libertarian | Mark Gailey | 2,952 | 1.94 | |||
| Total votes | 152,594 | 100.00 | ||||
| Voter turnout | % | |||||
| Democratic gain from Republican | ||||||
| Party | Candidate | Votes | % | |
|---|---|---|---|---|
| Democratic | Ben Chandler* | 175,355 | 58.61 | |
| Republican | Tom Buford | 119,716 | 40.01 | |
| Independent | Stacy Abner | 2,388 | 0.80 | |
| Libertarian | Mark Gailey | 1,758 | 0.59 | |
| Total votes | 299,217 | 100.00 | ||
| Voter turnout | % | |||
| Democratic hold | ||||
2006
| Party | Candidate | Votes | % | |
|---|---|---|---|---|
| Democratic | Ben Chandler* | 158,869 | 85.46 | |
| Libertarian | Paul Ard | 27,024 | 14.54 | |
| Total votes | 185,893 | 100.00 | ||
| Voter turnout | % | |||
| Democratic hold | ||||
2008
| Party | Candidate | Votes | % | |
|---|---|---|---|---|
| Democratic | Ben Chandler* | 203,764 | 64.66 | |
| Republican | Jon Larson | 111,378 | 35.34 | |
| Total votes | 315,142 | 100.00 | ||
| Voter turnout | % | |||
| Democratic hold | ||||
2010
| Party | Candidate | Votes | % | |
|---|---|---|---|---|
| Democratic | Ben Chandler* | 119,812 | 50.08 | |
| Republican | Andy Barr | 119,165 | 49.81 | |
| No party | C. Wes Collins | 225 | 0.09% | |
| No party | Randolph S. Vance | 22 | 0.01% | |
| Total votes | 239,224 | 100.00 | ||
| Voter turnout | % | |||
| Democratic hold | ||||
2012
| Party | Candidate | Votes | % | |||
|---|---|---|---|---|---|---|
| Republican | Andy Barr | 153,222 | 50.57 | |||
| Democratic | Ben Chandler* | 141,438 | 46.70 | |||
| No party | Randolph S. Vance | 8,340 | 2.75% | |||
| Total votes | 303,000 | 100.00 | ||||
| Voter turnout | % | |||||
| Republican gain from Democratic | ||||||
2014
| Party | Candidate | Votes | % | |
|---|---|---|---|---|
| Republican | Andy Barr* | 147,404 | 59.99 | |
| Democratic | Elisabeth Jensen | 98,290 | 40.00 | |
| Total votes | 245,694 | 100.00 | ||
| Voter turnout | % | |||
| Republican hold | ||||
Historical district boundaries
See also
References
- ↑ "Partisan Voting Index Districts of the 113th Congress: 2004 & 2008" (PDF). The Cook Political Report. 2012. Retrieved 2013-01-10.
- ↑ "Registration Statistics: By Congression District". Kentucky State Board of Elections. September 2013. Retrieved 2014-02-06.
- ↑ "Registration Statistics: Other Political Organizations and Groups". Kentucky State Board of Elections. September 2013. Retrieved 2014-02-06.
- ↑ "Kentucky Administrative Regulations 31KAR4:150". Kentucky Legislative Research Commission. November 2005. Retrieved 2014-02-06.
- ↑ "Register To Vote". Kentucky State Board of Elections. August 2003. Retrieved 2014-02-06.
- Martis, Kenneth C. (1989). The Historical Atlas of Political Parties in the United States Congress. New York: Macmillan Publishing Company.
- Martis, Kenneth C. (1982). The Historical Atlas of United States Congressional Districts. New York: Macmillan Publishing Company.
- Congressional Biographical Directory of the United States 1774–present
| United States House of Representatives | ||
|---|---|---|
| Preceded by Ohio's 8th congressional district |
Home district of the Speaker of the House December 3, 1883 – March 4, 1889 |
Succeeded by Maine's 1st congressional district |
Coordinates: 38°03′12″N 84°09′17″W / 38.05333°N 84.15472°W