Westmeath County Council election, 1999
Westmeath County Council election, 1999

|
|
|
|
|

|
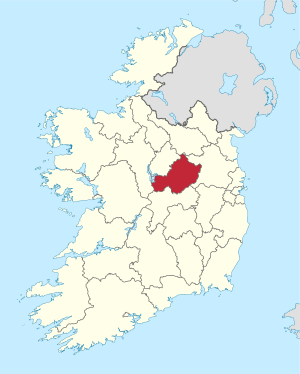
| Map showing the area of Westmeath County Council |
|
Council control after election
TBD
|
|
|
An election to Westmeath County Council took place on 10 June 1999 as part of that year's Irish local elections. 23 councillors were elected from five electoral divisions by PR-STV voting for a five-year term of office.
Results by party
Results by Electoral Area
Athlone
| Athlone - 7 seats |
| Party | Candidate | % 1st Pref | Count 1 | Count 2 | Count 3 | Count 4 | Count 5 | Count 6 | Count 7 | Count 8 | Count 9 |
|
Fianna Fáil |
P.J. Coghill* |
11.06 |
1,010 |
1,013 |
1,070 |
1,094 |
1,126 |
1,219 |
|
|
|
|
Fianna Fáil |
Kieran Molloy* |
10.86 |
992 |
1,022 |
1,044 |
1,054 |
1,080 |
1,299 |
|
|
|
|
Fine Gael |
Brendan McFadden* |
10.22 |
934 |
952 |
981 |
1,039 |
1,123 |
1,251 |
|
|
|
|
Fianna Fáil |
Tom Allen |
9.37 |
856 |
863 |
882 |
902 |
963 |
1,058 |
1,079 |
1,092 |
1,117 |
|
Fine Gael |
Mark Cooney |
9.33 |
852 |
873 |
901 |
967 |
1,039 |
1,103 |
1,119 |
1,131 |
1,141 |
|
Fianna Fáil |
Egbert Moran* |
8.46 |
773 |
780 |
796 |
843 |
882 |
947 |
1,005 |
1,032 |
1,060 |
|
Fianna Fáil |
Kevin (Boxer) Moran |
8.41 |
768 |
794 |
818 |
839 |
886 |
972 |
1,028 |
1,057 |
1,065 |
|
Fine Gael |
Joe Whelan* |
8.41 |
768 |
774 |
791 |
857 |
977 |
986 |
990 |
994 |
996 |
|
Fianna Fáil |
John Butler |
8.24 |
753 |
775 |
791 |
804 |
837 |
|
|
|
|
|
Labour Party |
Denis Rohan |
5.99 |
547 |
562 |
590 |
636 |
|
|
|
|
|
|
Fine Gael |
Dick O'Brien |
4.01 |
366 |
374 |
390 |
|
|
|
|
|
|
|
Independent |
Michael Fox |
3.04 |
278 |
315 |
|
|
|
|
|
|
|
|
Independent |
Benny Cooney |
2.62 |
239 |
|
|
|
|
|
|
|
|
| Electorate: 17,156 Valid: 9,136 (53.25%) Spoilt: 144 Quota: 1,143 Turnout: 9,280 (54.09%) |
Coole
| Coole - 3 seats |
| Party | Candidate | % 1st Pref | Count 1 | Count 2 |
|
Fianna Fáil |
Senator Donie Cassidy* |
31.33 |
1,157 |
|
|
Fianna Fáil |
P.J. O'Shaughnessy* |
27.73 |
1,024 |
|
|
Fine Gael |
Frank McDermott* |
26.00 |
960 |
|
|
Labour Party |
Johnnie Penrose |
13.48 |
498 |
693 |
|
Independent |
Peter Rogers |
1.46 |
54 |
92 |
| Electorate: 6,171 Valid: 3,693 (56.26%) Spoilt: 62 Quota: 924 Turnout: 3,755 (57.08%) |
Kilbeggan
Mullingar East
| Mullingar East - 4 seats |
| Party | Candidate | % 1st Pref | Count 1 | Count 2 | Count 3 | Count 4 | Count 5 |
|
Labour Party |
Mick Dollard* |
33.11 |
1,595 |
|
|
|
|
|
Fianna Fáil |
Jim Bourke |
14.61 |
704 |
788 |
827 |
874 |
1,075 |
|
Fine Gael |
Patrick McLoughlin |
13.62 |
656 |
688 |
709 |
800 |
915 |
|
Labour Party |
Dan McCarthy |
11.73 |
565 |
964 |
|
|
|
|
Fianna Fáil |
Tommy Wright* |
10.05 |
484 |
515 |
554 |
580 |
721 |
|
Fianna Fáil |
Shay Callaghan |
9.78 |
471 |
492 |
506 |
515 |
|
|
Fine Gael |
Pat Whelan |
3.84 |
185 |
222 |
237 |
|
|
|
Independent |
Kevin Whelehan |
3.28 |
158 |
185 |
|
|
|
| Electorate: 9,026 Valid: 4,818 (53.38%) Spoilt: 63 Quota: 964 Turnout: 4,881 (54.08%) |
Mullingar West
External links
