The 2008 San Francisco Board of Supervisors elections occurred on November 4, 2008. Seven of the eleven seats of the San Francisco Board of Supervisors were contested in this election. Four incumbents were termed out of office, while three ran for reelection.
Municipal elections in California are officially non-partisan, though most candidates in San Francisco do receive funding and support from various political parties. The election was held using ranked-choice voting.
Results
District 1
This district consists of the Richmond District. Incumbent supervisor Jake McGoldrick was termed out of office.
District 1 supervisorial election, 2008[1][2]
| Candidate |
Votes |
Percentage |
| Eric Mar |
11,625 |
40.52% |
| Sue Lee |
9,733 |
33.93% |
| Alicia Wang |
4,206 |
14.66% |
| Brian Larkin |
995 |
3.47% |
| Jason Jungreis |
610 |
2.13% |
| Nicholas Belloni |
536 |
1.87% |
| Fidel Gakuba |
361 |
1.26% |
| George Flamik |
324 |
1.13% |
| Sherman D'Silva |
254 |
0.89% |
| Write-in |
42 |
0.15% |
| Valid votes |
29,643 |
90.79% |
| Invalid or blank votes |
3,008 |
9.21% |
| Total votes |
32,651 |
100.00% |
| Voter turnout |
80.76% |
| Ranked choice voting — Pass 1 |
| Eric Mar |
11,649 |
40.51% |
| Sue Lee |
9,753 |
33.92% |
| Alicia Wang (eliminated) |
4,218 |
14.67% |
| Brian Larkin (eliminated) |
998 |
3.47% |
| Jason Jungreis (eliminated) |
614 |
2.14% |
| Nicholas Belloni (eliminated) |
537 |
1.87% |
| Fidel Gakuba (eliminated) |
363 |
1.26% |
| George Flamik (eliminated) |
325 |
1.13% |
| Sherman D'Silva (eliminated) |
257 |
0.89% |
| Write-in (eliminated) |
42 |
0.15% |
| Eligible votes |
28,756 |
90.73% |
| Exhausted votes |
2,938 |
9.27% |
| Total votes |
31,694 |
100.00% |
| Ranked choice voting — Pass 2
|
| Eric Mar |
13,152 |
50.67% |
| Sue Lee |
12,805 |
49.33% |
| Eligible votes |
25,957 |
81,90% |
| Exhausted votes |
5,737 |
18.10% |
| Total votes |
31,694 |
100.00% |
District 3
District 3 consists of the northeastern corner of San Francisco, including Chinatown, the Financial District, Fisherman's Wharf, Nob Hill, North Beach, and Telegraph Hill. Incumbent supervisor Aaron Peskin was termed out of office.
District 3 supervisorial election, 2008[1][3]
| Candidate |
Votes |
Percentage |
| David Chiu |
10,209 |
37.72% |
| Joseph Alioto, Jr. |
6,268 |
23.16% |
| Denise McCarthy |
3,165 |
11.69% |
| Claudine Cheng |
2,492 |
9.21% |
| Mike DeNunzio |
1,330 |
4.91% |
| Lynn Jefferson |
1,234 |
4.56% |
| Tony Gantner |
1,191 |
4.40% |
| Wilma Pang |
939 |
3.47% |
| Mark Quessey |
204 |
0.75% |
| Write-in |
35 |
0.13% |
| Valid votes |
28,276 |
90.33% |
| Invalid or blank votes |
3,028 |
9.67% |
| Total votes |
31,304 |
100.00% |
| Voter turnout |
80.44% |
| Ranked choice voting — Pass 7
|
| David Chiu |
13,582 |
59.37% |
| Joseph Alioto, Jr. |
9,293 |
40.63% |
| Eligible votes |
22,875 |
76.03% |
| Exhausted votes |
7,211 |
23.97% |
| Total votes |
30,086 |
100.00% |
Ranked-choice vote distribution
| Candidate | Pass 1 | Pass 2 | Pass 3 | Pass 4 | Pass 5 | Pass 6 | Pass 7 |
| David Chiu | 10,270 | 10,512 | 10,800 | 10,919 | 11,146 | 12,348 | 13,582 |
| Joseph Alioto, Jr. | 6,285 | 6,400 | 6,655 | 7,113 | 7,423 | 8,175 | 9,293 |
| Denise McCarthy | 3,172 | 3,341 | 3,572 | 3,715 | 4,227 | 4,633 | |
| Claudine Cheng | 2,515 | 2,779 | 2,886 | 3,027 | 3,223 | |
| Lynn Jefferson | 1,235 | 1,365 | 1,471 | 1,650 | |
| Mike DeNunzio | 1,335 | 1,386 | 1,466 | |
| Tony Gantner | 1,195 | 1,235 | |
| Wilma Pang | 952 | |
| Mark Quessey | 204 |
| Write-in | 35 |
| Eligible ballots | 27,198 | 27,018 | 26,850 | 26,424 | 26,019 | 25,156 | 22,875 |
| Exhausted ballots | 2,888 | 3,068 | 3,236 | 3,662 | 4,067 | 4,930 | 7,211 |
| Total | 30,086 | 30,086 | 30,086 | 30,086 | 30,086 | 30,086 | 30,086 |
District 4
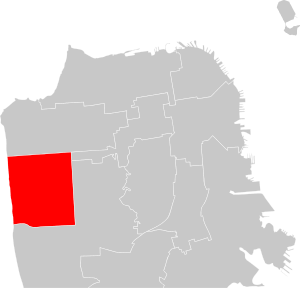
District 4 consists primarily of the Sunset district. Incumbent supervisor Carmen Chu was seeking her first election after being appointed by Mayor Gavin Newsom in the wake of Ed Jew's suspension and resignation.
District 4 supervisorial special election, 2008[1][4]
| Candidate |
Votes |
Percentage |
| Carmen Chu (incumbent) |
15,353 |
52.37% |
| Ron Dudum |
10,304 |
35.15% |
| David Ferguson |
3,606 |
12.30% |
| Write-in |
53 |
0.18% |
| Valid votes |
30,060 |
92.86% |
| Invalid or blank votes |
2,312 |
7.14% |
| Total votes |
32,372 |
100.00% |
| Voter turnout |
79.14% |
| Ranked choice voting — Pass 1
|
| Carmen Chu (incumbent) |
15,405 |
52.33% |
| Ron Dudum |
10,346 |
35.14% |
| David Ferguson |
3,635 |
12.35% |
| Write-in |
53 |
0.18% |
| Eligible votes |
29,439 |
93.08% |
| Exhausted votes |
2,189 |
6.92% |
| Total votes |
31,628 |
100.00% |
District 5
District 5 consists of the Fillmore, Haight-Ashbury, Hayes Valley, Japantown, UCSF, and the Western Addition. Incumbent supervisor Ross Mirkarimi was seeking reelection.
District 5 supervisorial election, 2008[1]
| Candidate |
Votes |
Percentage |
| Ross Mirkarimi (incumbent) |
27,482 |
77.39% |
| Owen P. O'Connell |
5,962 |
16.79% |
| Rob Anderson |
1,982 |
5.58% |
| Write-in |
87 |
0.24% |
| Valid votes |
37,408 |
86.85% |
| Invalid or blank votes |
5,662 |
13.15% |
| Total votes |
43,070 |
100.00% |
| Voter turnout |
83.33% |
District 7
District 7 consists of City College, Forest Hill, Lake Merced, Mount Davidson, Parkmerced, San Francisco State University, St. Francis Wood, and Twin Peaks. Incumbent supervisor Sean Elsbernd was seeking reelection.
District 7 supervisorial election, 2008[1]
| Candidate |
Votes |
Percentage |
| Sean Elsbernd (incumbent) |
22,019 |
71.06% |
| Julian Lagos |
5,792 |
18.69% |
| Billy Bob Whitmer |
2,964 |
9.57% |
| Write-in |
211 |
0.68% |
| Valid votes |
32,420 |
85.09% |
| Invalid or blank votes |
5,683 |
14.91% |
| Total votes |
38,103 |
100.00% |
| Voter turnout |
84.04% |
District 9
District 9 consists of Bernal Heights, the Inner Mission, and part of the Portola. Incumbent supervisor Tom Ammiano was termed out of office.
District 9 supervisorial election, 2008[1][5]
| Candidate |
Votes |
Percentage |
| David Campos |
9,440 |
35.78% |
| Mark Sanchez |
7,616 |
28.86% |
| Eric Quezada |
5,337 |
20.23% |
| Eva Royale |
1,830 |
6.94% |
| Thomas Valtin |
857 |
3.25% |
| Eric Storey |
802 |
3.04% |
| Vern Mathews |
466 |
1.77% |
| Write-in |
39 |
0.15% |
| Valid votes |
27,183 |
91.59% |
| Invalid or blank votes |
2,497 |
8.41% |
| Total votes |
29,680 |
100.00% |
| Voter turnout |
81.46% |
| Ranked choice voting — Pass 3
|
| David Campos |
12,637 |
53.83% |
| Mark Sanchez |
10,837 |
46.17% |
| Eligible votes |
23,474 |
81.27% |
| Exhausted votes |
5,410 |
18.73% |
| Total votes |
28,884 |
100.00% |
Ranked-choice vote distribution
| Candidate | Pass 1 | Pass 2 | Pass 3 |
| David Campos | 9,468 | 10,387 | 12,637 |
| Mark Sanchez | 7,648 | 8,623 | 10,837 |
| Eric Quezada | 5,352 | 5,964 | |
| Eva Royale | 1,842 | |
| Thomas Valtin | 862 |
| Eric Storey | 806 |
| Vern Mathews | 469 |
| Write-in | 39 |
| Eligible ballots | 26,486 | 24,974 | 23,474 |
| Exhausted ballots | 2,398 | 3,910 | 5,410 |
| Total | 28,884 | 28,884 | 28,884 |
District 11
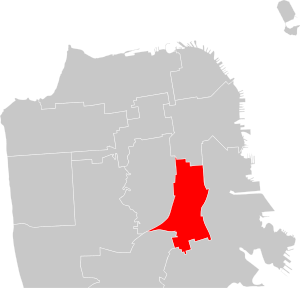
District 11 consists of the Excelsior, Ingleside, Oceanview, and the Outer Mission. Incumbent supervisor Gerardo Sandoval was termed out of office.
District 11 supervisorial election, 2008[1][6]
| Candidate |
Votes |
Percentage |
| John Avalos |
6,918 |
28.19% |
| Ahsha Safaì |
5,941 |
24.21% |
| Myrna Lim |
4,442 |
18.10% |
| Julio Ramos |
3,626 |
14.78% |
| Randall Knox |
2,324 |
9.47% |
| Mary Goodnature |
455 |
1.85% |
| Adrian Bermudez |
410 |
1.67% |
| Eli Horn |
391 |
1.59% |
| Write-in |
24 |
0.10% |
| A. Jackson Matteson |
6 |
0.02% |
| Valid votes |
25,126 |
91.37% |
| Invalid or blank votes |
2,372 |
8.63% |
| Total votes |
27,498 |
100.00% |
| Voter turnout |
76.21% |
| Ranked choice voting — Pass 4
|
| John Avalos |
10,225 |
52.93% |
| Ahsha Safaì |
9,092 |
47.07% |
| Eligible votes |
19,317 |
71.79% |
| Exhausted votes |
7,592 |
28.21% |
| Total votes |
26,909 |
100.00% |
Ranked-choice vote distribution
| Candidate | Pass 1 | Pass 2 | Pass 3 | Pass 4 |
| John Avalos | 6,964 | 7,625 | 8,887 | 10,225 |
| Ahsha Safaì | 5,941 | 5,965 | 6,727 | 7,611 |
| Myrna Lim | 4,462 | 5,053 | 5,929 | |
| Julio Ramos | 3,646 | 4,321 | |
| Randall Knox | 2,337 | |
| Mary Goodnature | 459 |
| Adrian Bermudez | 415 |
| Eli Horn | 394 |
| Write-in | 30 |
| A. Jackson Matteson | 1 |
| Eligible ballots | 24,673 | 23,726 | 22,427 | 19,317 |
| Exhausted ballots | 2,236 | 3,183 | 4,482 | 7,592 |
| Total | 26,909 | 26,909 | 26,909 | 26,909 |
References
- 1 2 3 4 5 6 7 "November 4, 2008 General Election Statement of Vote" (PDF). San Francisco Department of Elections. Retrieved December 24, 2010.
- ↑ "District 1 – Ranked-choice voting". San Francisco Department of Elections. December 2, 2008. Retrieved December 24, 2010.
- ↑ "District 3 – Ranked-choice voting". San Francisco Department of Elections. December 2, 2008. Retrieved December 24, 2010.
- ↑ "District 4 – Ranked-choice voting". San Francisco Department of Elections. December 2, 2008. Retrieved December 24, 2010.
- ↑ "District 9 – Ranked-choice voting". San Francisco Department of Elections. December 2, 2008. Retrieved December 24, 2010.
- ↑ "District 11 – Ranked-choice voting". San Francisco Department of Elections. December 2, 2008. Retrieved December 24, 2010.
External links
(2007 ←) California elections, 2008 (→ 2009) |
|---|
|
| February primary election | |
|---|
|
| June primary election | |
|---|
|
| November general election |
- Presidential
- United States House of Representatives
- State Senate
- State Assembly
- Propositions: 1A, 2, 3, 4, 5, 6, 7, 8, 9, 10, 11, and 12
|
|---|
|
| Special elections | |
|---|
|
| Local elections | |
|---|


