Stevenage Borough Council election, 2012
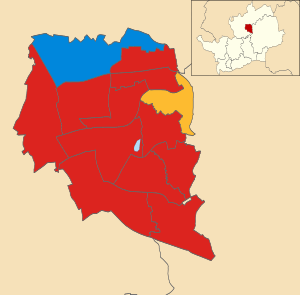
Map of the results of the 2012 Stevenage council election. Labour in red, Conservatives in blue and Liberal Democrats in yellow.
Elections to Stevenage Borough Council were held on 3 May 2012. One third of the council were elected.
The composition of the council after the election was:
- Labour 30
- Conservative 6
- Liberal Democrat 3
Election result
| Stevenage Local Election Result 2012 | ||||||||||
|---|---|---|---|---|---|---|---|---|---|---|
| Party | Seats | Gains | Losses | Net gain/loss | Seats % | Votes % | Votes | +/− | ||
| Labour | 11 | 3 | 0 | +3 | 84.6 | 52.6 | 10498 | +5.8% | ||
| Conservative | 1 | 0 | 3 | -3 | 7.7 | 28.8 | 5740 | -2.4% | ||
| Liberal Democrat | 1 | 0 | 0 | ±0 | 7.7 | 11.6 | 2309 | +1.3% | ||
| UKIP | 0 | 0 | 0 | ±0 | 0 | 2.9 | 587 | -7.1% | ||
| TUSC | 0 | 0 | 0 | ±0 | 0 | 2.2 | 438 | +1.0% | ||
| Green | 0 | 0 | 0 | ±0 | 0 | 1.9 | 377 | +1.5% | ||
Ward Results
| Party | Candidate | Votes | % | ± | |
|---|---|---|---|---|---|
| Labour | Michelle Gardner | 814 | 53.8 | +6.5 | |
| Conservative | Sharon Hearn | 492 | 32.5 | -0.5 | |
| Liberal Democrat | Barbara Segadelli | 105 | 6.9 | +0.8 | |
| TUSC | Amanda Dilley | 101 | 6.7 | +3.6 | |
| Majority | 322 | 21.3 | +7.0 | ||
| Turnout | 1512 | 30.7 | -9.2 | ||
| Labour hold | Swing | ||||
| Party | Candidate | Votes | % | ± | |
|---|---|---|---|---|---|
| Labour | David Cullen | 897 | 56.8 | +0.1 | |
| Conservative | Ellin Joseph | 258 | 16.3 | -5.3 | |
| UKIP | Sean Howlett | 218 | 13.8 | +0.6 | |
| Green | Ian Cropton | 88 | 5.6 | -0.2 | |
| Liberal Democrat | Debra Betts | 78 | 4.9 | +4.9 | |
| TUSC | Steve Glennon | 39 | 2.5 | -0.2 | |
| Majority | 639 | 40.5 | +5.4 | ||
| Turnout | 1578 | 31.1 | -8.7 | ||
| Labour hold | Swing | ||||
| Party | Candidate | Votes | % | ± | |
|---|---|---|---|---|---|
| Labour | Vickie Warwick | 875 | 56.2 | +8.2 | |
| Conservative | Matthew Wyatt | 382 | 24.5 | -0.6 | |
| Liberal Democrat | Gareth Steiner | 201 | 12.9 | -1.6 | |
| TUSC | Mark Pickersgill | 100 | 6.4 | +6.4 | |
| Majority | 493 | 31.6 | +8.8 | ||
| Turnout | 1558 | 31.1 | -10.8 | ||
| Labour hold | Swing | ||||
| Party | Candidate | Votes | % | ± | |
|---|---|---|---|---|---|
| Labour | Lorraine Bell | 778 | 47.0 | +5.1 | |
| Conservative | Matthew Hurst | 596 | 36.0 | -0.3 | |
| Liberal Democrat | Ralph Baskerville | 172 | 10.4 | +0.6 | |
| TUSC | Helen Kerr | 109 | 6.6 | +3.5 | |
| Majority | 182 | 11.0 | +5.4 | ||
| Turnout | 1655 | 36.4 | -8.1 | ||
| Labour gain from Conservative | Swing | ||||
| Party | Candidate | Votes | % | ± | |
|---|---|---|---|---|---|
| Liberal Democrat | Graham Snell | 837 | 45.6 | +4.3 | |
| Labour | Amanda King | 566 | 30.8 | +4.9 | |
| Conservative | Susan Smith | 432 | 23.5 | -2.2 | |
| Majority | 271 | 14.8 | -0.6 | ||
| Turnout | 1835 | 36.6 | -11.0 | ||
| Liberal Democrat hold | Swing | ||||
| Party | Candidate | Votes | % | ± | |
|---|---|---|---|---|---|
| Labour | Maureen McKay | 835 | 60.1 | +12.2 | |
| Conservative | Dilys Clark | 425 | 30.6 | -5.0 | |
| Liberal Democrat | Kevin Aylward | 130 | 9.4 | +2.6 | |
| Majority | 410 | 29.5 | +17.2 | ||
| Turnout | 1390 | 29.7 | -12.1 | ||
| Labour gain from Conservative | Swing | ||||
| Party | Candidate | Votes | % | ± | |
|---|---|---|---|---|---|
| Labour | Jim Brown | 1020 | 49.5 | +1.8 | |
| Conservative | James Fraser | 783 | 38.0 | +1.0 | |
| Green | Elizabeth Sturges | 159 | 7.7 | +7.7 | |
| Liberal Democrat | Matthew Snell | 99 | 4.8 | -2.9 | |
| Majority | 237 | 11.5 | +0.8 | ||
| Turnout | 2061 | 33.8 | -9.3 | ||
| Labour gain from Conservative | Swing | ||||
| Party | Candidate | Votes | % | ± | |
|---|---|---|---|---|---|
| Labour | Simon Speller | 861 | 58.1 | +7.3 | |
| Conservative | Bill Whelan | 336 | 22.7 | -9.2 | |
| UKIP | Michael Kumar | 188 | 12.7 | +2.1 | |
| Liberal Democrat | Amanda Piroth | 97 | 6.5 | -0.2 | |
| Majority | 525 | 35.4 | +16.4 | ||
| Turnout | 1482 | 31.9 | -9.3 | ||
| Labour hold | Swing | ||||
| Party | Candidate | Votes | % | ± | |
|---|---|---|---|---|---|
| Labour | John Lloyd | 758 | 52.8 | +3.9 | |
| Conservative | Adam Mitchell | 424 | 29.5 | -3.6 | |
| Green | Graham White | 130 | 9.1 | +9.1 | |
| Liberal Democrat | Denise Baskerville | 83 | 5.8 | +5.8 | |
| TUSC | Bryan Clare | 41 | 2.9 | -0.4 | |
| Majority | 334 | 23.2 | +7.3 | ||
| Turnout | 1436 | 30.3 | -9.8 | ||
| Labour hold | Swing | ||||
| Party | Candidate | Votes | % | ± | |
|---|---|---|---|---|---|
| Labour | Richard Henry | 860 | 62.6 | +9.8 | |
| Conservative | Gillian Mould | 352 | 25.6 | -2.0 | |
| Liberal Democrat | Heather Snell | 162 | 11.8 | +1.8 | |
| Majority | 508 | 37.0 | +11.8 | ||
| Turnout | 1374 | 28.9 | -11.9 | ||
| Labour hold | Swing | ||||
| Party | Candidate | Votes | % | ± | |
|---|---|---|---|---|---|
| Labour | Jack Pickersgill | 760 | 58.7 | +4.3 | |
| Conservative | Michelle Calcutt | 215 | 16.6 | -5.8 | |
| UKIP | Andrea Taylor | 181 | 14.0 | +4.5 | |
| Liberal Democrat | Nicholas Baskerville | 91 | 7.0 | -2.1 | |
| TUSC | Barbara Clare | 48 | 3.7 | -0.9 | |
| Majority | 545 | 42.1 | +10.2 | ||
| Turnout | 1295 | 28.6 | -8.4 | ||
| Labour hold | Swing | ||||
| Party | Candidate | Votes | % | ± | |
|---|---|---|---|---|---|
| Labour | Laurie Chester | 953 | 63.2 | +4.8 | |
| Conservative | Paul Mould | 431 | 28.6 | +0.5 | |
| Liberal Democrat | Clive Hearmon | 123 | 8.2 | +2.2 | |
| Majority | 522 | 34.6 | +4.3 | ||
| Turnout | 1507 | 33.6 | -9.5 | ||
| Labour hold | Swing | ||||
| Party | Candidate | Votes | % | ± | |
|---|---|---|---|---|---|
| Conservative | Margaret Notley | 614 | 48.5 | +0.5 | |
| Labour | Jim Callaghan | 521 | 41.2 | +8.5 | |
| Liberal Democrat | Katherine Lloyd-Manning | 131 | 10.3 | +1.4 | |
| Majority | 93 | 7.3 | -2.3 | ||
| Turnout | 1266 | 30.3 | -12.2 | ||
| Conservative hold | Swing | ||||
References
- "2012 Election Results". Stevenage Borough Council. 4 May 2012. Retrieved 4 May 2012.
This article is issued from Wikipedia - version of the 4/30/2015. The text is available under the Creative Commons Attribution/Share Alike but additional terms may apply for the media files.