Wigan Metropolitan Borough Council election, 2010
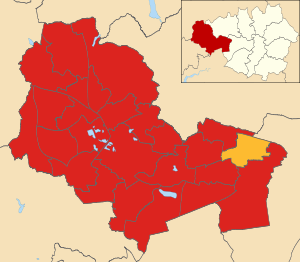
Map of the results of the 2010 Wigan council election. Labour in red and Liberal Democrats in yellow.
Elections to Wigan Council were held on 6 May 2010. One-third of the council was up for election.[1][2][3]
Election result
| Wigan Local Election Result 2010 | ||||||||||
|---|---|---|---|---|---|---|---|---|---|---|
| Party | Seats | Gains | Losses | Net gain/loss | Seats % | Votes % | Votes | +/− | ||
| Labour | 24 | 10 | 0 | +10 | 96.0 | 45.5 | 63,404 | +8.2% | ||
| Liberal Democrat | 1 | 0 | 1 | -1 | 4.0 | 8.9 | 12,447 | +0.3% | ||
| Conservative | 0 | 0 | 2 | -2 | 0.0 | 18.7 | 26,036 | -7.3% | ||
| Community Action | 0 | 0 | 2 | -2 | 0.0 | 8.0 | 11,129 | -5.9% | ||
| Independent | 0 | 0 | 3 | -3 | 0.0 | 7.3 | 10,254 | -1.6% | ||
| BNP | 0 | 0 | 0 | 0 | 0.0 | 6.5 | 9,116 | +3.2% | ||
| Independent Conservative | 0 | 0 | 2 | -2 | 0.0 | 3.1 | 4,351 | +3.1% | ||
| UKIP | 0 | 0 | 0 | 0 | 0.0 | 1.3 | 1,797 | -0.0% | ||
| England First | 0 | 0 | 0 | 0 | 0.0 | 0.1 | 134 | +0.1% | ||
This result had the following consequences for the total number of seats on the Council after the elections:
| Party | Previous council | New council | |||
|---|---|---|---|---|---|
| Labour | 41 | 51 | |||
| Conservative | 10 | 8 | |||
| Independent | 10 | 7 | |||
| Community Action | 6 | 4 | |||
| Liberal Democrat | 4 | 3 | |||
| Wigan Independent Conservative | 4 | 2 | |||
| BNP | 0 | 0 | |||
| UKIP | 0 | 0 | |||
| England First | 0 | 0 | |||
| Total | 75 | 75 | |||
| Working majority | 7 | 27 | |||
Ward results
Abram
| Party | Candidate | Votes | % | ± | |
|---|---|---|---|---|---|
| Labour | Carl Sweeney | 2,849 | 52.7 | +4.9 | |
| Independent | Sandra Atherton | 893 | 16.5 | +16.5 | |
| Conservative | Marie Winstanley | 668 | 12.4 | -2.7 | |
| BNP | Dennis Shambley | 659 | 12.2 | +12.2 | |
| Community Action | John Shale | 316 | 5.8 | -30.9 | |
| Rejected ballots | 20 | 0.4 | -0.1 | ||
| Majority | 1,956 | 36.2 | +25.2 | ||
| Turnout | 5,405 | 51.8 | +26.7 | ||
| Labour hold | Swing | -5.8 | |||
Ashton
| Party | Candidate | Votes | % | ± | |
|---|---|---|---|---|---|
| Labour | Dennis Ash | 2,208 | 38.7 | +5.1 | |
| Community Action | Joanne Bradley | 1,980 | 34.7 | -18.6 | |
| Independent | Frank Merry | 574 | 10.1 | +10.1 | |
| Conservative | Malcolm Childs | 571 | 10.0 | +2.5 | |
| BNP | Barry Longstaffe | 352 | 6.2 | +0.8 | |
| Rejected ballots | 20 | 0.4 | +0.1 | ||
| Majority | 228 | 4.0 | -15.8 | ||
| Turnout | 5,705 | 63.1 | +26.2 | ||
| Labour hold | Swing | +11.8 | |||
Aspull, New Springs, Whelley
| Party | Candidate | Votes | % | ± | |
|---|---|---|---|---|---|
| Labour | Ronald Conway | 3,133 | 49.6 | +6.6 | |
| Liberal Democrat | Trevor Beswick | 1,470 | 23.3 | -14.1 | |
| Conservative | Jane Surples | 1,175 | 18.6 | -0.5 | |
| BNP | Andrew Jones | 430 | 6.8 | +6.8 | |
| Independent Conservative | Ian Bland | 90 | 1.4 | +1.4 | |
| Rejected ballots | 20 | 0.3 | -0.2 | ||
| Majority | 1,663 | 26.3 | +20.7 | ||
| Turnout | 6,318 | 64.1 | +29.7 | ||
| Labour gain from Liberal Democrat | Swing | +10.3 | |||
Astley Mosley Common
| Party | Candidate | Votes | % | ± | |
|---|---|---|---|---|---|
| Labour | Barry Taylor | 2,339 | 39.5 | +4.2 | |
| Liberal Democrat | Gavin Clements | 1,894 | 32.0 | +10.0 | |
| Conservative | Nasri Barghothi | 1,635 | 27.6 | -14.4 | |
| Rejected ballots | 47 | 0.8 | +0.2 | ||
| Majority | 445 | 7.5 | +0.8 | ||
| Turnout | 5,915 | 63.1 | +32.2 | ||
| Labour gain from Independent | Swing | -2.9 | |||
Atherleigh
| Party | Candidate | Votes | % | ± | |
|---|---|---|---|---|---|
| Labour | Pamela Stewart | 2,038 | 43.3 | -15.4 | |
| Conservative | Derek Davies | 871 | 18.5 | -21.9 | |
| Liberal Democrat | Lisa Clements | 711 | 15.1 | +15.1 | |
| Independent | Neil Wade | 447 | 9.5 | +9.5 | |
| BNP | Gary Chadwick | 386 | 8.2 | +8.2 | |
| Community Action | Julie Finch | 254 | 5.4 | +5.4 | |
| Rejected ballots | 0 | 0.0 | -0.9 | ||
| Majority | 1,167 | 24.8 | +6.5 | ||
| Turnout | 4,707 | 56.0 | +29.6 | ||
| Labour hold | Swing | +3.2 | |||
Atherton
| Party | Candidate | Votes | % | ± | |
|---|---|---|---|---|---|
| Labour | Karen Aldred | 2,758 | 45.2 | +19.3 | |
| Conservative | Vivienne Lee | 961 | 15.7 | +2.9 | |
| Independent | Jamie Hodgkinson | 852 | 14.0 | -15.5 | |
| Liberal Democrat | Gareth Clements | 850 | 13.9 | -10.9 | |
| Community Action | Stephen Hall | 655 | 10.7 | +10.7 | |
| Rejected ballots | 30 | 0.5 | +0.1 | ||
| Majority | 1,797 | 29.4 | +25.8 | ||
| Turnout | 6,106 | 57.0 | +25.6 | ||
| Labour hold | Swing | +8.2 | |||
Bryn
| Party | Candidate | Votes | % | ± | |
|---|---|---|---|---|---|
| Labour | Margaret Rampling | 2,274 | 40.2 | +16.7 | |
| Independent | Brian Merry | 1,697 | 30.0 | -19.2 | |
| Community Action | Kevin Williams | 609 | 10.8 | -1.3 | |
| BNP | Ken Haslam | 531 | 9.4 | +0.7 | |
| Conservative | Joseph Sheedy | 525 | 9.3 | +3.0 | |
| Rejected ballots | 25 | 0.4 | +0.0 | ||
| Majority | 577 | 10.2 | -15.6 | ||
| Turnout | 5,661 | 62.4 | +26.3 | ||
| Labour gain from Independent | Swing | +17.9 | |||
Douglas
| Party | Candidate | Votes | % | ± | |
|---|---|---|---|---|---|
| Labour | Shirley Dewhurst | 2,742 | 58.7 | +7.3 | |
| Conservative | Margaret Atherton | 659 | 14.1 | -1.3 | |
| BNP | Ian Lloyd | 461 | 9.9 | +9.9 | |
| Community Action | Jayne Bryan | 396 | 8.5 | -24.2 | |
| Independent | Anthony Unsworth | 380 | 8.1 | +8.1 | |
| Rejected ballots | 34 | 0.7 | +0.2 | ||
| Majority | 2,083 | 44.6 | +25.9 | ||
| Turnout | 4,672 | 48.9 | +24.4 | ||
| Labour hold | Swing | +4.3 | |||
Golborne Lowton West
| Party | Candidate | Votes | % | ± | |
|---|---|---|---|---|---|
| Labour | Gerard Bretherton | 2,554 | 49.9 | +8.9 | |
| Community Action | Peter Franzen | 1,431 | 28.0 | -10.4 | |
| Conservative | Kathleen Houlton | 775 | 15.2 | +5.4 | |
| BNP | Steven McEllenborough | 329 | 6.4 | +0.3 | |
| Rejected ballots | 26 | 0.5 | +0.3 | ||
| Majority | 1,123 | 22.0 | +19.4 | ||
| Turnout | 5,115 | 58.0 | +25.1 | ||
| Labour hold | Swing | +9.6 | |||
Hindley
| Party | Candidate | Votes | % | ± | |
|---|---|---|---|---|---|
| Labour | James Talbot | 2,558 | 49.2 | +24.7 | |
| Independent | David Culshaw | 1,346 | 25.9 | -39.6 | |
| Conservative | David Ollerton | 610 | 11.7 | +2.0 | |
| BNP | Stephen Bradbury | 501 | 9.6 | +9.6 | |
| Community Action | Peter Solinas | 152 | 2.9 | +2.9 | |
| Rejected ballots | 28 | 0.5 | +0.3 | ||
| Majority | 1,212 | 23.3 | -17.7 | ||
| Turnout | 5,195 | 52.7 | +23.6 | ||
| Labour hold | Swing | +32.1 | |||
Hindley Green
| Party | Candidate | Votes | % | ± | |
|---|---|---|---|---|---|
| Labour | David Stitt | 1,658 | 31.5 | +5.0 | |
| Independent | Francis Carmichael | 1,476 | 28.0 | -16.7 | |
| Community Action | Barry Fagan | 1,087 | 20.6 | +6.4 | |
| Conservative | Margaret Winstanley | 593 | 11.3 | -3.0 | |
| BNP | Darren Mark Taylor | 427 | 8.1 | +8.1 | |
| Rejected ballots | 28 | 0.5 | +0.1 | ||
| Majority | 182 | 3.5 | -14.7 | ||
| Turnout | 5,269 | 61.7 | +32.9 | ||
| Labour gain from Community Action | Swing | +10.8 | |||
Ince
| Party | Candidate | Votes | % | ± | |
|---|---|---|---|---|---|
| Labour | James Moodie | 2,559 | 60.8 | +0.3 | |
| BNP | James Harrison | 570 | 13.5 | +13.5 | |
| Conservative | Raymond Whittingham | 402 | 9.6 | -4.6 | |
| Community Action | Robert Hall | 300 | 7.1 | -17.4 | |
| Independent | Brian Kenrick | 224 | 5.3 | +5.3 | |
| England First | Robert Hague | 134 | 3.2 | +3.2 | |
| Rejected ballots | 18 | 0.4 | -0.3 | ||
| Majority | 1,989 | 47.3 | +11.3 | ||
| Turnout | 4,207 | 48.3 | +25.3 | ||
| Labour hold | Swing | -6.6 | |||
Leigh East
| Party | Candidate | Votes | % | ± | |
|---|---|---|---|---|---|
| Labour | Frederick Walker | 2,422 | 48.2 | +4.3 | |
| Liberal Democrat | Gordon Jackson | 1,373 | 27.3 | +0.9 | |
| Conservative | Richard Short | 1,183 | 23.5 | -5.5 | |
| Rejected ballots | 51 | 1.0 | +0.3 | ||
| Majority | 1,049 | 20.9 | +6.1 | ||
| Turnout | 5,029 | 55.9 | +31.0 | ||
| Labour hold | Swing | +1.7 | |||
Leigh South
| Party | Candidate | Votes | % | ± | |
|---|---|---|---|---|---|
| Labour | Charles Rigby | 2,571 | 40.8 | -0.4 | |
| Conservative | Stanley Walker | 1,196 | 19.0 | -11.1 | |
| Liberal Democrat | Chris Blackburn | 1,002 | 15.9 | +15.9 | |
| Community Action | Clive Charles | 583 | 9.3 | -5.0 | |
| BNP | Adam Lloyd | 516 | 8.2 | -5.9 | |
| Independent | Philip Symonds | 279 | 4.4 | +4.4 | |
| Independent Conservative | Elaine Brown | 125 | 2.0 | +2.0 | |
| Rejected ballots | 24 | 0.4 | +0.1 | ||
| Majority | 1,375 | 21.8 | +10.6 | ||
| Turnout | 6,296 | 61.6 | +29.0 | ||
| Labour hold | Swing | +5.3 | |||
Leigh West
| Party | Candidate | Votes | % | ± | |
|---|---|---|---|---|---|
| Labour | Peter Smith | 2,509 | 46.5 | -17.8 | |
| Liberal Democrat | Richard Derricutt | 828 | 15.3 | +15.3 | |
| BNP | Martin Grainey | 693 | 12.8 | +12.8 | |
| Conservative | John Oxley | 557 | 10.3 | -23.7 | |
| Independent | David Hull | 280 | 5.2 | +5.2 | |
| Independent | Brian Turrell | 255 | 4.7 | +4.7 | |
| UKIP | Mary Lavelle | 247 | 4.6 | +4.6 | |
| Rejected ballots | 28 | 0.5 | -1.1 | ||
| Majority | 1,681 | 31.1 | +0.8 | ||
| Turnout | 5,397 | 51.3 | +28.5 | ||
| Labour hold | Swing | -16.5 | |||
Lowton East
| Party | Candidate | Votes | % | ± | |
|---|---|---|---|---|---|
| Labour | James Cowley | 2,403 | 38.0 | +17.4 | |
| Conservative | Ed Houlton | 2,315 | 36.6 | -17.0 | |
| Community Action | Ian Franzen | 1,591 | 25.1 | -0.5 | |
| Rejected ballots | 18 | 0.3 | +0.1 | ||
| Majority | 88 | 1.4 | -26.6 | ||
| Turnout | 6,327 | 65.6 | +27.7 | ||
| Labour gain from Community Action | Swing | +17.2 | |||
Orrell
| Party | Candidate | Votes | % | ± | |
|---|---|---|---|---|---|
| Labour | David Arrowsmith | 2,877 | 46.1 | +18.1 | |
| Conservative | Stuart Foy | 2,317 | 37.2 | -9.3 | |
| BNP | Charles Foy | 697 | 11.2 | -4.7 | |
| Independent Conservative | Paula Thompson | 286 | 4.6 | +4.6 | |
| Rejected ballots | 58 | 0.9 | +0.6 | ||
| Majority | 560 | 9.0 | -9.5 | ||
| Turnout | 6,235 | 67.5 | +29.7 | ||
| Labour gain from Conservative | Swing | +13.7 | |||
Pemberton
| Party | Candidate | Votes | % | ± | |
|---|---|---|---|---|---|
| Labour | Paul Prescott | 3,219 | 65.5 | +9.8 | |
| Conservative | Jonathan Cartwright | 617 | 12.6 | -1.5 | |
| BNP | Christopher Hilton | 596 | 12.1 | -1.3 | |
| Community Action | Michael Leyland | 451 | 9.2 | -7.1 | |
| Rejected ballots | 32 | 0.7 | +0.1 | ||
| Majority | 2,602 | 52.9 | +13.5 | ||
| Turnout | 4,915 | 50.1 | +24.2 | ||
| Labour hold | Swing | +5.6 | |||
Shevington with Lower Ground
| Party | Candidate | Votes | % | ± | |
|---|---|---|---|---|---|
| Labour | Michael Crosby | 2,180 | 34.3 | +3.6 | |
| Conservative | Anthony Hind | 1,404 | 22.1 | -26.3 | |
| Independent Conservative | Angela Bland | 1,210 | 19.1 | +19.1 | |
| Liberal Democrat | Daniel Clarke | 995 | 15.7 | +7.7 | |
| UKIP | John Atherton | 534 | 8.4 | +0.5 | |
| Rejected ballots | 28 | 0.4 | +0.4 | ||
| Majority | 776 | 12.2 | -5.5 | ||
| Turnout | 6,351 | 68.3 | +34.2 | ||
| Labour gain from Independent Conservative | Swing | +14.9 | |||
Standish with Langtree
| Party | Candidate | Votes | % | ± | |
|---|---|---|---|---|---|
| Labour | Emma McGurrin | 2,097 | 32.1 | +1.2 | |
| Conservative | Steven Surples | 1,894 | 29.0 | -21.8 | |
| Independent Conservative | Neil Dunlop | 1,021 | 15.6 | +15.6 | |
| Liberal Democrat | Alan Robinson | 1,009 | 15.4 | +9.1 | |
| UKIP | Alan Freeman | 280 | 4.3 | -4.1 | |
| BNP | Graham Lawrence | 228 | 3.5 | +3.5 | |
| Rejected ballots | 13 | 0.2 | +0.1 | ||
| Majority | 203 | 3.1 | -16.8 | ||
| Turnout | 6,542 | 68.4 | +32.8 | ||
| Labour gain from Conservative | Swing | +11.5 | |||
Tyldesley
| Party | Candidate | Votes | % | ± | |
|---|---|---|---|---|---|
| Liberal Democrat | Paul Valentine | 2,315 | 39.5 | -26.2 | |
| Labour | Anita Thorpe | 1,875 | 32.0 | +10.0 | |
| Conservative | Hilary Hayden | 930 | 15.9 | +4.6 | |
| BNP | David Peacock | 450 | 7.7 | +7.7 | |
| Independent | Joseph Haley | 272 | 4.6 | +4.6 | |
| Rejected ballots | 13 | 0.2 | -0.8 | ||
| Majority | 440 | 7.5 | -36.2 | ||
| Turnout | 5,855 | 58.3 | +30.5 | ||
| Liberal Democrat hold | Swing | -18.1 | |||
Wigan Central
| Party | Candidate | Votes | % | ± | |
|---|---|---|---|---|---|
| Labour | George Davies | 2,477 | 41.9 | +11.6 | |
| Conservative | Robert Gibson | 1,522 | 25.7 | -24.5 | |
| Independent Conservative | Gareth Fairhurst | 1,090 | 18.4 | +18.4 | |
| UKIP | Keith Jones | 475 | 8.0 | -4.1 | |
| BNP | Anthony Farrell | 306 | 5.2 | +5.2 | |
| Rejected ballots | 47 | 0.8 | +0.3 | ||
| Majority | 955 | 16.1 | -3.9 | ||
| Turnout | 5,917 | 64.8 | +30.5 | ||
| Labour gain from Independent Conservative | Swing | +18.0 | |||
Wigan West
| Party | Candidate | Votes | % | ± | |
|---|---|---|---|---|---|
| Labour | Phyllis Cullen | 3,437 | 61.4 | +17.7 | |
| Conservative | Christopher McGowan | 970 | 17.3 | -1.6 | |
| BNP | Susan Mather | 608 | 10.9 | -3.6 | |
| Independent Conservative | Andrew Lomax | 529 | 9.5 | +9.5 | |
| Rejected ballots | 50 | 0.9 | +0.7 | ||
| Majority | 2,467 | 44.1 | +19.3 | ||
| Turnout | 5,594 | 57.5 | +32.4 | ||
| Labour hold | Swing | +9.6 | |||
Winstanley
| Party | Candidate | Votes | % | ± | |
|---|---|---|---|---|---|
| Labour | Clive Morgan | 2,465 | 43.4 | +10.1 | |
| Independent | William Wilkes | 1,279 | 22.5 | +22.5 | |
| Conservative | Victoria Ashurst | 852 | 15.0 | -4.4 | |
| Community Action | Ronald Barnes | 433 | 7.6 | -39.3 | |
| BNP | Adrian Jones | 376 | 6.6 | +6.6 | |
| UKIP | Arnold Foster | 261 | 4.6 | +4.6 | |
| Rejected ballots | 14 | 0.2 | -0.1 | ||
| Majority | 1,186 | 20.9 | +7.2 | ||
| Turnout | 5,680 | 64.8 | +35.0 | ||
| Labour gain from Independent | Swing | -6.2 | |||
Worsley Mesnes
| Party | Candidate | Votes | % | ± | |
|---|---|---|---|---|---|
| Labour | Lynne Holland | 3,202 | 64.5 | +9.4 | |
| Community Action | Arthur Fairhurst | 891 | 17.9 | -10.6 | |
| Conservative | Marion Green | 834 | 16.8 | +1.1 | |
| Rejected ballots | 38 | 0.8 | +0.1 | ||
| Majority | 2,311 | 46.5 | +20.0 | ||
| Turnout | 4,965 | 56.2 | +29.9 | ||
| Labour hold | Swing | +10.0 | |||
By-elections between 2010 and 2011
| Party | Candidate | Votes | % | ± | |
|---|---|---|---|---|---|
| Labour | Lawrence Hunt | 1,165 | 48.6 | +6.7 | |
| Conservative | Robin Gibson | 652 | 27.2 | +1.5 | |
| Independent Conservative | Gareth Fairhurst | 393 | 16.4 | -2.0 | |
| UKIP | Keith Davies | 189 | 7.9 | -0.1 | |
| Majority | 513 | 21.4 | +5.3 | ||
| Turnout | 2,399 | 25.6 | -39.2 | ||
| Labour gain from Conservative | Swing | +2.6 | |||
References
- ↑ "Election 2010: Wigan council". BBC News Online. 19 April 2009. Retrieved 2012-07-04.
- 1 2 3 4 5 6 7 8 9 10 11 12 13 14 15 16 17 18 19 20 21 22 23 24 25 26 "Local Election Results 06 May 2010". wiganmbc.gov.uk. Retrieved 2012-06-28.
- 1 2 3 4 5 6 7 8 9 10 11 12 13 14 15 16 17 18 19 20 21 22 23 24 25 26 "Local Elections Archive Project: 2010 - Wigan". andrewteale.me.uk. Retrieved 2012-06-28.
- ↑ "Council by-election wins for Labour". London: The Independent. 4 March 2011. Retrieved 2012-07-05.
- ↑ "Local Authority Byelection Results". gwydir.demon.co.uk. Retrieved 2012-06-13.
| Mayor | |
|---|---|
| Bolton | |
| Bury | |
| Manchester | |
| Oldham | |
| Rochdale | |
| Salford | |
| Stockport | |
| Tameside | |
| Trafford | |
| Wigan | |
| County Council |
|
| |
This article is issued from Wikipedia - version of the 10/20/2016. The text is available under the Creative Commons Attribution/Share Alike but additional terms may apply for the media files.