Hastings Borough Council election, 2010
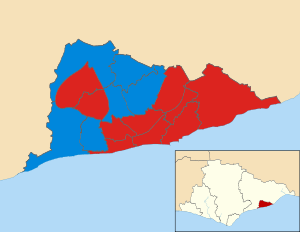
Map of the results of the 2010 Hastings council election. Labour in red and Conservatives in blue.
The 2010 Hastings Borough Council elections were held on 6 May 2010, with half of the council's seats up for election. The Labour party regained control of the council from no overall control, despite suffering a heavy defeat in the nationwide general election that was held on the same day. Overall turnout was 61.9%. The election in Ore ward was delayed due to the death of the Conservative candidate following the close of nominations.[1]
After the election, the composition of the council was
- Labour 17
- Conservative 14
- Liberal Democrat 1
Election result
| Hastings Local Election Result 2010 | ||||||||||
|---|---|---|---|---|---|---|---|---|---|---|
| Party | Seats | Gains | Losses | Net gain/loss | Seats % | Votes % | Votes | +/− | ||
| Labour | 11 | 5 | 0 | +5 | 64.7 | 40.2 | 15,352 | +5.5 | ||
| Conservative | 6 | 0 | 3 | -3 | 35.3 | 37.2 | 14,222 | -5.3 | ||
| Liberal Democrat | 0 | 0 | 2 | -2 | 0 | 20.6 | 7,857 | +1.6 | ||
| BNP | 0 | 0 | 0 | 0 | 0 | 1.4 | 531 | -0.7 | ||
| Independent | 0 | 0 | 0 | 0 | 0 | 0.7 | 252 | +0.7 | ||
Ward results
| Party | Candidate | Votes | % | ± | |
|---|---|---|---|---|---|
| Conservative | John Wilson | 1,568 | 51.2 | -13.2 | |
| Labour | Terri Dowling | 867 | 28.3 | +9.4 | |
| Liberal Democrat | Alan Roscoe | 625 | 20.4 | +3.8 | |
| Majority | 701 | 22.9 | -22.6 | ||
| Turnout | 3,060 | 65.8 | +31.1 | ||
| Conservative hold | Swing | ||||
| Party | Candidate | Votes | % | ± | |
|---|---|---|---|---|---|
| Labour | Mike Turner | 889 | 42.8 | +4.8 | |
| Conservative | Terry Fawthrop | 829 | 39.9 | -11.1 | |
| Liberal Democrat | Susan Tait | 359 | 17.3 | +6.3 | |
| Majority | 60 | 2.9 | |||
| Turnout | 2,077 | 58.3 | +20.7 | ||
| Labour gain from Conservative | Swing | ||||
| Party | Candidate | Votes | % | ± | |
|---|---|---|---|---|---|
| Labour | Godfrey Daniel | 1,360 | 54.5 | +1.3 | |
| Conservative | Amanda Charlesworth | 702 | 28.1 | -5.9 | |
| Liberal Democrat | Oliver Maloney | 432 | 17.3 | +4.5 | |
| Majority | 658 | 26.4 | +7.2 | ||
| Turnout | 2,494 | 66.1 | +24.8 | ||
| Labour hold | Swing | ||||
| Party | Candidate | Votes | % | ± | |
|---|---|---|---|---|---|
| Labour | Lee Clark | 1,226 | 50.0 | +3.5 | |
| Conservative | Graeme Williams | 627 | 25.6 | +9.7 | |
| Liberal Democrat | Colin Dormer | 598 | 24.4 | +5.9 | |
| Majority | 599 | 24.4 | -3.6 | ||
| Turnout | 2,451 | 55.8 | +19.1 | ||
| Labour gain from Liberal Democrat | Swing | ||||
| Party | Candidate | Votes | % | ± | |
|---|---|---|---|---|---|
| Labour | Jeremy Birch | 1,123 | 53.5 | +7.0 | |
| Conservative | Bhatti Anwar | 530 | 25.2 | -1.6 | |
| Liberal Democrat | Paul Smith | 447 | 21.3 | +5.9 | |
| Majority | 593 | 28.3 | +8.6 | ||
| Turnout | 2,100 | 50.3 | +18.9 | ||
| Labour hold | Swing | ||||
| Party | Candidate | Votes | % | ± | |
|---|---|---|---|---|---|
| Conservative | Eve Martin | 1,461 | 53.0 | +4.1 | |
| Labour | David Baker | 745 | 27.0 | +13.5 | |
| Liberal Democrat | Anne Gallop | 551 | 20.0 | -10.5 | |
| Majority | 716 | 26.0 | -19.4 | ||
| Turnout | 2,757 | 72.1 | +26.7 | ||
| Conservative hold | Swing | ||||
| Party | Candidate | Votes | % | ± | |
|---|---|---|---|---|---|
| Labour | Andrew Cartwright | 1,095 | 46.6 | +9.5 | |
| Conservative | Rob Lee | 682 | 29.0 | -1.7 | |
| Liberal Democrat | Chris Benner | 573 | 24.4 | -7.8 | |
| Majority | 413 | 17.6 | +12.7 | ||
| Turnout | 2,350 | 57.6 | +20.9 | ||
| Labour gain from Conservative | Swing | ||||
| Party | Candidate | Votes | % | ± | |
|---|---|---|---|---|---|
| Labour | Bruce Dowling | 844 | 21.7 | ||
| Labour | Emily Westley | 734 | 18.9 | ||
| Conservative | Liam Atkins | 707 | 18.2 | ||
| Conservative | Mark Charlesworth | 631 | 16.2 | ||
| Liberal Democrat | Vanessa Burton | 428 | 11.0 | ||
| Liberal Democrat | Tricia Kennelly | 328 | 8.4 | ||
| BNP | David Lovett | 217 | 5.6 | ||
| Turnout | 3,889 | 53.1 | +28.0 | ||
| Labour hold | Swing | ||||
| Labour hold | Swing | ||||
| Party | Candidate | Votes | % | ± | |
|---|---|---|---|---|---|
| Conservative | Joy Waite | 1,195 | 48.8 | -14.1 | |
| Labour | Ted Bacon | 749 | 30.6 | +8.2 | |
| Liberal Democrat | Christopher Dodwell | 506 | 20.7 | +6.0 | |
| Majority | 446 | 18.2 | -22.3 | ||
| Turnout | 2,450 | 60.4 | +25.7 | ||
| Conservative hold | Swing | ||||
| Party | Candidate | Votes | % | ± | |
|---|---|---|---|---|---|
| Labour | John Hodges | 1,153 | 39.5 | +9.3 | |
| Conservative | Stuart Padget | 952 | 32.6 | -2.3 | |
| Liberal Democrat | Stuart Murphy | 811 | 27.8 | -7.2 | |
| Majority | 201 | 6.9 | |||
| Turnout | 2,916 | 67.1 | +24.3 | ||
| Labour gain from Liberal Democrat | Swing | ||||
| Party | Candidate | Votes | % | ± | |
|---|---|---|---|---|---|
| Labour | Michael Wincott | 608 | 47.7 | +12.8 | |
| Conservative | Stuart Padget | 475 | 37.3 | -13.0 | |
| Liberal Democrat | Anne Scott | 158 | 12.4 | -2.4 | |
| BNP | Nick Prince | 33 | 2.6 | +2.6 | |
| Majority | 133 | 10.4 | |||
| Turnout | 1,274 | 34.2 | -0.1 | ||
| Labour gain from Conservative | Swing | ||||
| Party | Candidate | Votes | % | ± | |
|---|---|---|---|---|---|
| Conservative | Andrew Gurney | 854 | 36.5 | -10.8 | |
| Labour | Nigel Sinden | 838 | 35.8 | -3.3 | |
| Liberal Democrat | Christopher Beamount | 397 | 17.0 | +3.4 | |
| Independent | Stephen Springthorpe | 252 | 10.8 | +10.8 | |
| Majority | 16 | 0.7 | -7.4 | ||
| Turnout | 2,341 | 67.4 | +34.1 | ||
| Conservative hold | Swing | ||||
| Party | Candidate | Votes | % | ± | |
|---|---|---|---|---|---|
| Conservative | Simon Corello | 1,276 | 43.4 | -15.1 | |
| Labour | Michael Ward | 1,098 | 37.4 | +13.2 | |
| Liberal Democrat | John Tunbridge | 546 | 19.2 | +2.0 | |
| Majority | 178 | 6.0 | -28.3 | ||
| Turnout | 2,920 | 73.4 | +23.3 | ||
| Conservative hold | Swing | ||||
| Party | Candidate | Votes | % | ± | |
|---|---|---|---|---|---|
| Labour | Jay Kramer | 876 | 45.8 | +8.8 | |
| Conservative | John Dawson | 487 | 25.5 | -2.2 | |
| Liberal Democrat | Charlene Floyd | 401 | 21.0 | +0.3 | |
| BNP | Nick Prince | 147 | 7.7 | -6.9 | |
| Majority | 389 | 20.3 | +11.1 | ||
| Turnout | 1,911 | 54.8 | +25.3 | ||
| Labour hold | Swing | ||||
| Party | Candidate | Votes | % | ± | |
|---|---|---|---|---|---|
| Conservative | Peter Finch | 1,105 | 44.6 | -3.9 | |
| Labour | Ken Maitland | 830 | 33.5 | -4.3 | |
| Liberal Democrat | Tony Seymour | 542 | 21.9 | +8.3 | |
| Majority | 275 | 11.1 | +0.4 | ||
| Turnout | 2,477 | 63.9 | +28.1 | ||
| Conservative hold | Swing | ||||
| Party | Candidate | Votes | % | ± | |
|---|---|---|---|---|---|
| Labour | Alan Roberts | 1,051 | 43.4 | -3.3 | |
| Conservative | Chris Pillow | 772 | 31.9 | -6.0 | |
| Liberal Democrat | Jane Wainwright | 465 | 19.2 | +3.8 | |
| BNP | Mick Turner | 134 | 5.5 | +5.5 | |
| Majority | 279 | 11.5 | +2.7 | ||
| Turnout | 2,422 | 62.7 | +26.4 | ||
| Labour hold | Swing | ||||
References
| East Sussex County Council | |
|---|---|
| Brighton and Hove City Council | |
| Eastbourne Borough Council | |
| Hastings Borough Council | |
| Lewes District Council |
|
| Rother District Council | |
| Wealden District Council | |
| Brighton Borough Council |
|
| Hove Borough Council |
|
| |
This article is issued from Wikipedia - version of the 2/7/2015. The text is available under the Creative Commons Attribution/Share Alike but additional terms may apply for the media files.