New South Wales state election, 1976
| | ||||||||||||||||||||||||||||||||||||||||||||
| ||||||||||||||||||||||||||||||||||||||||||||
| ||||||||||||||||||||||||||||||||||||||||||||
|
| ||||||||||||||||||||||||||||||||||||||||||||
| Legislative Assembly after the election | ||||||||||||||||||||||||||||||||||||||||||||
| ||||||||||||||||||||||||||||||||||||||||||||
A general election for the New South Wales Legislative Assembly was held in the state of New South Wales, Australia, on Saturday 1 May 1976. The result was a narrow win for the Australian Labor Party under Neville Wran—the party's first in the state in more than a decade.
Issues
The incumbent Liberal-Country Party coalition had lost its longtime leader, Sir Robert Askin, at the end of 1974. His successor, Tom Lewis, didn't last a year as premier before his colleagues dumped him in favour of Eric Willis.
Wran successfully emerged from the shadow of the defeated Whitlam Labor government at a federal level. Labor's campaign focussed largely on the leader himself, what Australians call a "Presidential" style campaign. The state party had undergone a long process of renewal, and emerged with strong moderate credentials. Labor also offered an alternative to a long-serving government widely perceived as corrupt.
Wran's campaign slogan, "Let's put the state in better shape," delivered by the leader and key spokesmen Peter Cox and Syd Einfeld, resonated with voters.
Key dates
| Date | Event |
|---|---|
| 2 April 1976 | The Legislative Assembly was dissolved, and writs were issued by the Governor to proceed with an election.[1] |
| 8 April 1976 | Nominations for candidates for the election closed at noon. |
| 1 May 1976 | Polling day, between the hours of 8am and 6pm. |
| 14 May 1976 | The Willis–Punch ministry resigned and the First Wran ministry was sworn in. |
| 21 May 1976 | The writ was returned and the results formally declared. |
| 25 May 1976 | Parliament resumed for business. |
Results
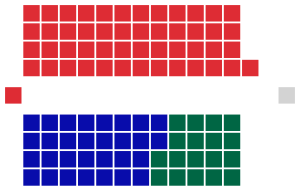
The election was in doubt for several days. Ultimately, the seats of Gosford and Hurstville fell to Labor by only 74 and 44 votes respectively. Had the Coalition retained these seats, it would have stayed in power with a one-seat majority. As it turned out, the loss of Gosford and Hurstville gave Wran a one-seat majority.
|
New South Wales state election, 1 May 1976[2][3] | ||||||
|---|---|---|---|---|---|---|
| Enrolled voters | 2,943,248[1] | |||||
| Votes cast | 2,745,749 | Turnout | 93.29 | +0.78 | ||
| Informal votes | 48,220 | Informal | 1.76 | –0.94 | ||
| Summary of votes by party | ||||||
| Party | Primary votes | % | Swing | Seats | Change | |
| Labor | 1,342,038 | 49.75 | +6.82 | 50 | + 6 | |
| Liberal | 978,886 | 36.29 | +2.44 | 30 | – 4 | |
| Country | 270,603 | 10.03 | –0.45 | 18 | ± 0 | |
| Workers | 15,598 | 0.58 | +0.58 | 0 | ± 0 | |
| Australia Party | 7,407 | 0.27 | –3.93 | 0 | ± 0 | |
| Socialist Workers | 2,495 | 0.09 | +0.09 | 0 | ± 0 | |
| Communist | 2,220 | 0.08 | +0.05 | 0 | ± 0 | |
| Democratic Labor | 2,201 | 0.08 | –5.88 | 0 | – 1 | |
| Independent | 76,089 | 2.82 | +0.28 | 1 | – 1 | |
| Total | 2,697,529 | 99 | ||||
- 1 There were 2,989,786 enrolled voters but 46,538 were enrolled in electorates (one Labor and one Country) which were uncontested at the election.
Post-election pendulum
See also
Notes
- ↑ Parliament of New South Wales. "1976 Election". Retrieved 6 February 2010.
- ↑ Australian Government and Politics Database. "Parliament of New South Wales, Assembly election, 1 May 1976". Retrieved 6 February 2010.
- ↑ Hughes, Colin A. (1986). A handbook of Australian government and politics, 1975-1984. ANU Press. p. 190. ISBN 0-08-033038-X.


